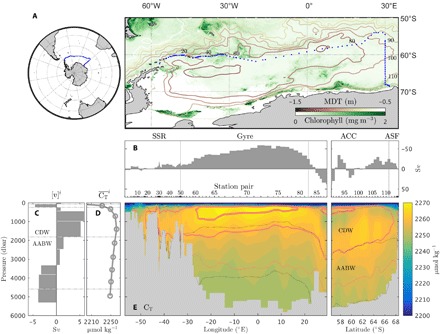
Fig. 2. Circulation and carbon in the Weddell Gyre.

(A) Location of the Weddell Gyre and hydrographic sections. On the right panel, contours of mean dynamic topography (MDT) are plotted, revealing the cyclonic gyre circulation (contours every 0.1 m). These data are the June-July-August mean in 2005, taken from the Southern Ocean State Estimate (41). The 2008 annual mean chlorophyll-a concentration, derived from satellite measurements of ocean color, is also plotted (green shading) (47). (B) Cumulative horizontal circulation around the boundary of the Weddell Gyre, derived from the inversion (11). Volume transports for each station pair are integrated from left to right. Note the reversed direction of the y axis such that export is upward. (C) Overturning circulation in the Weddell Gyre, derived from the inversion, in neutral density layers. Bars correspond to the volume transport in each layer ([v]i). The center location and thickness of each bar correspond to the mean depth and thickness of that layer. Horizontal dotted lines denote the interfaces between major water masses. (D) Area-weighted mean carbon concentration in each layer . (E) Carbon concentration, CT, around the Weddell Gyre. As for (C) and (D), dotted lines denote the interfaces between the major water masses. Pink contours correspond to the concentrations (80, 90, and 100 μmol kg−1) of the remineralized organic matter component (Csoft) of the carbon partitioning formulation (see Materials and Methods), with thicker contours denoting greater concentration.
