
Fig. 5. Cushing’s mutations are located in allosteric nodes identified via CHESCA.
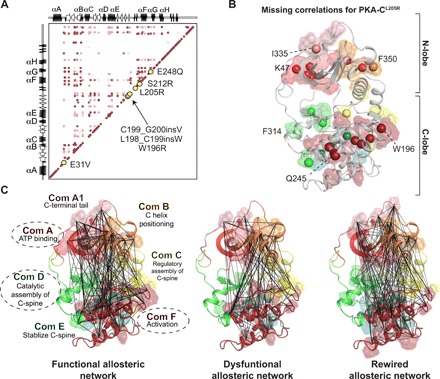
(A) Correlation matrix of PKA-CWT when bound to PKI emphasizing locations of Cushing’s mutation in relation to allosteric nodes. (B) Missing correlations for PKA-CL205R upon binding PKI colored according to the community map of PKA-CWT. (C) CHESCA correlation matrices for PKA-CWT + PKI, PKA-CL205R + PKI, and PKA-CL205R + VPS36, respectively, plotted on the structure of PKA-C with colors specific to the community map analyses completed previously for PKA-CWT (35). Specific communities are emphasized to highlight elements that experience the most dramatic changes in the number and extent of chemical shift covariance for PKA-CL205R upon binding PKI and VPS36.