. 2019 Aug 14;8:e49158. doi: 10.7554/eLife.49158

Figure 4. Neuronal RAGA-1 drives mitochondrial fragmentation in muscle cells.

(a) Representative pictures showing that loss of raga-1 preserves muscle mitochondrial content during aging, while neuronal RAGA-1 reverses these effects as seen in the corresponding skeletonized images (Left) post MitoMAPR processing. The mitochondrial skeleton (red) is overlaid on binary images. TOMM-20aa1-49::GFP reporter labels mitochondria in young (day 2) and old (day 11) wild type, raga-1(ok386) mutant and raga-1 neuronal rescue animals (n = 2 independent trials, 16–29 cells were imaged per genotype each time point per replicate). Scale bar represents 25 μm. (b) zoomed insets from (a) (yellow boxes). (c–h) Quantification showing that neuronal raga-1 rescue animals also have decreased mitochondrial coverage (c), greater degree of fragmentation as seen by decreased mitochondrial length (d) and area (e) and increased object number normalized to area (f) compared to raga-1 mutants. Data are represented as mean ±S.D. P value: NS no significance, *<0.05, **<0.01, ***<0.001, between comparisons as indicated by bars. Statistical significance was determined by One-way ANOVA and Welch’s t test. 16–29 cells were quantified per genotype for each time point per replicate (n = 2 independent trials, 25–30 cells were imaged per genotype each time point per replicate). Source data are provided in Figure 4—source data 1.

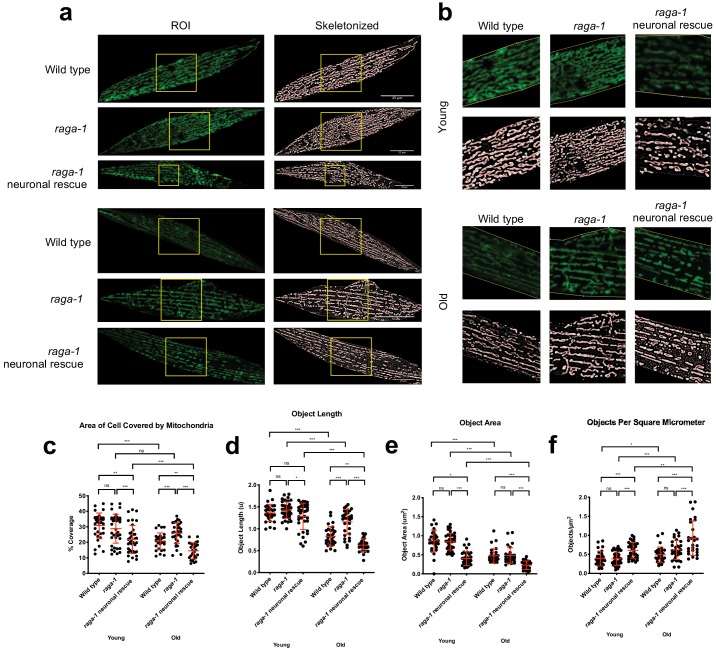
Figure 4—source data 1. Figure 4c-h and Figure 4—figure supplement 5 Effects of neuronal raga-1 rescue on parameters of muscle mitochondrial morphology.
DOI: 10.7554/eLife.49158.027

Figure 4.

Figure 4—figure supplement 1. Workflow for MitoMAPR analysis.

Figure 4—figure supplement 1.

A Region of Interest (15 × 15 um) was processed by the MitoMAPR macro. The ROI is enhanced for signal intensity by Enhance Local Contrast (CLAHE) followed by conversion to Binary. The binary image is then skeletonized and the skeletonized image is then processed by the AnalyzeSkeleton plugin to generated Tagged and Labelled Skeletons. Labelled Skeleton has each Object-Skeleton marked out in different colors to illustrate separation and Object Count (OC). Tagged Skeletons have junction points marked out in purple. The top zoomed inset illustrates two separate objects and one Network (N) with one Junction point. The bottom inset illustrates one network with three individual Junction Points (JP). The signal intensity from the binary image is used for area calculations to determine the Mitochondrial Footprint (MF) which then divided by the Object Count (OC) to calculate the Object Area (OA).
Figure 4—figure supplement 2. Examples of networks analyzed by MitoMAPR.

Figure 4—figure supplement 2.

Using Networks (N) and Junction Point (JP) values, it is possible to estimate the degree of complexity of the mitochondrial network. As illustrated the four cells (A–D) have their mitochondria marked out in green. The mitochondrial objects are counted in orange (Object Counts), Networks in black and Junction Points (JP) are marked out in purple. While panel A has three objects, it has only two networks, with one Junction Point in one network and three in the other. Panel B has no networks since none of the objects have any junction points. Conversely, panel D has three distinct objects and two networks. The larger network has 9 Junction points while the smaller one possesses a single junction point. A higher number of junction points indicates a greater degree of branching and larger network spread. Building on these attributes, compared to samples A-C, sample D exhibits a higher mitochondrial complexity and interconnectivity.
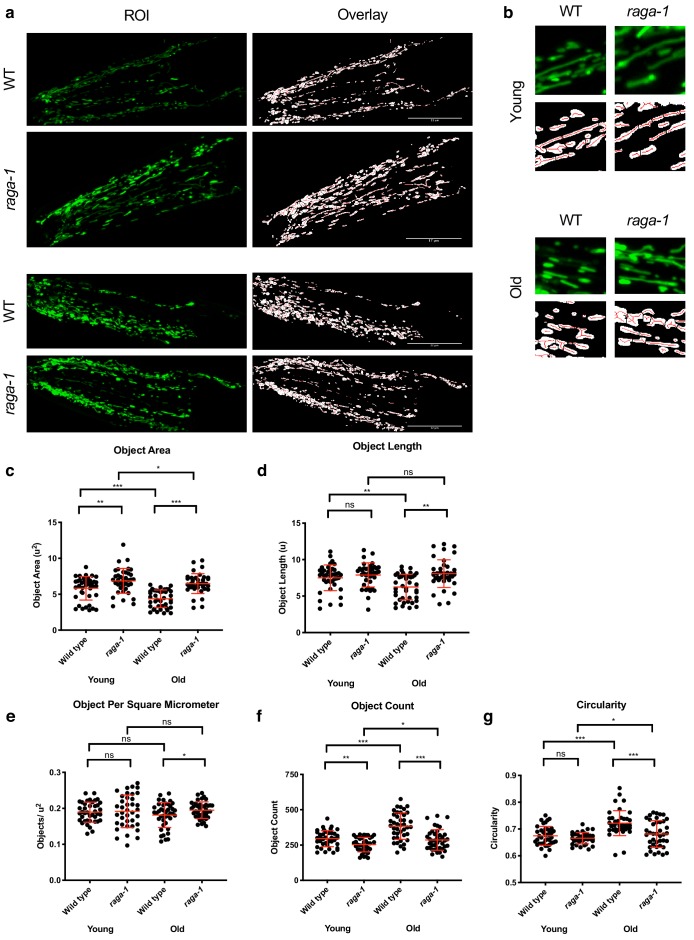
Figure 4—figure supplement 3. raga-1 deletion affects mitochondrial network states in neurons.

Figure 4—figure supplement 3.

(a–b) Representative pictures (a) showing that loss of raga-1 preserves mitochondrial content during aging, in neurons as seen in the overlay images (Left) post MitoMAPR processing. The mitochondrial backbone (red) is overlaid on binary images. TOMM-20aa1-49::GFP reporter labels mitochondria in young (day 1/2) and old (day 15) wild type and raga-1(ok386) mutant (n = 3 independent trials,~30 cells were imaged per genotype each time point per replicate). Scale bar represents 25 μm. (b) zoomed insets from (a). (c–g) Quantification showing that raga-1 deletion animals exhibit increased object area (c) and object length (d) compared to aged wildtype animals in neurons. In accordance to these observations, the raga-1 deletion animals also have decreased mitochondrial particle count (f), mitochondrial particles per unit area (e) and circularity (g) indicating a tendency for to maintain a fused mitochondrial network state even at day 15. Data are represented as mean ±S.D.. P value: NS no significance, *<0.05, **<0.01, ***<0.001, between comparisons as indicated by bars. Statistical significance was determined by One-way ANOVA and Welch’s t test. 16–29 cells were quantified per genotype for each time point per replicate (n = 3 independent trials,~30 cells were imaged per genotype each time point per replicate).
Figure 4—figure supplement 3—source data 1. Figure 4—figure supplement 3c-f Effects of neuronal raga-1 rescue on parameters of neuronal mitochondrial morphology.
DOI: 10.7554/eLife.49158.028
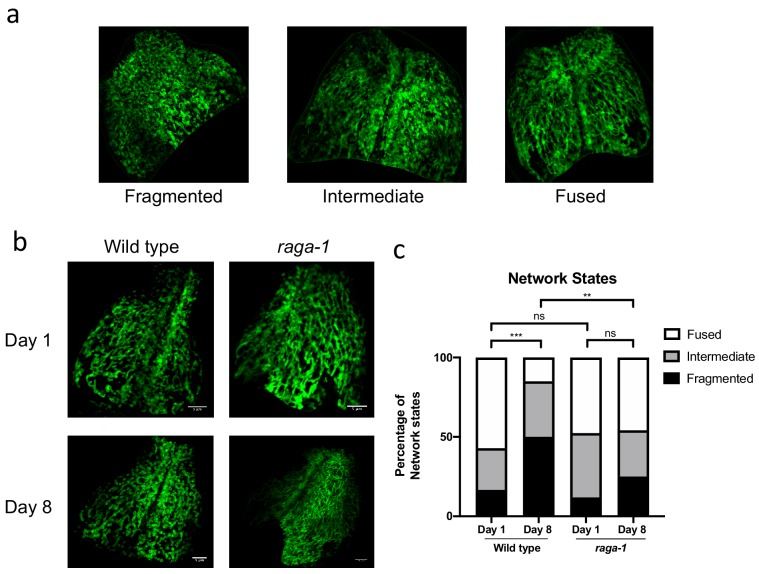
Figure 4—figure supplement 4. raga-1 deletion prevents mitochondria fragmentation in intestine.

Figure 4—figure supplement 4.

(a) Mitochondrial architecture in the intestine can be categorized manually into fragmented, intermediate and fused network states. (b) Representative pictures showing that loss of raga-1 preserves mitochondrial content during aging, while the mitochondrial morphology undergoes age related fragmentation in aged wild type animals. (c) Categorization of intestinal mitochondria in wild type and raga-1 mutant animals with age. Based on the groups Fragmented, Intermediate and Fused, the blinded data sets were categorized individually and represented in the graphs as percentage of total population. Statistics on the data were derived from Chi-square test performed between Wt_day1 and Wt_day8, Wt_day1 and raga-1_day1, Wt_day8 and raga-1_day8 and raga-1_day1 and raga-1_day8. ns no significance, *<0.05, **<0.01, ***<0.001, between comparisons as indicated by bars. Age dependent changes in Mitochondrial network states was also derived by performing Chi-square test for trend between Wt_day1 and Wt_day8 and raga-1_day1 and raga-1_day8. Chi-square test for trend results: Wt_day1 vs Wt _day8; P value = <0.0001 (***); raga-1_day1 vs raga-1 _day 8 = 0.3544 (ns).
Figure 4—figure supplement 4—source data 1. Figure 4—figure supplement 4c Network states of intestinal mitochondria in raga-1 mutants.
DOI: 10.7554/eLife.49158.029
Figure 4—figure supplement 5. Neuronal raga-1 expression alters muscle mitochondrial architecture.

Figure 4—figure supplement 5.

Quantification showing that neuronal raga-1 rescue animals also have decreased network count (a) and number of junction points (b) indicating that the mitochondrial architecture in these animals are of lower complexity and exhibit decreased interconnectedness. Data are represented as mean ±S.D. P value: NS no significance, *<0.05, **<0.01, ***<0.001, between comparisons as indicated by bars. Statistical significance was determined by One-way ANOVA and Welch’s t test. 16–29 cells were quantified per genotype for each time point per replicate (n = 2 independent trials, 25–30 cells were imaged per genotype each time point per replicate). Source data are provided in Figure 4—source data 1.
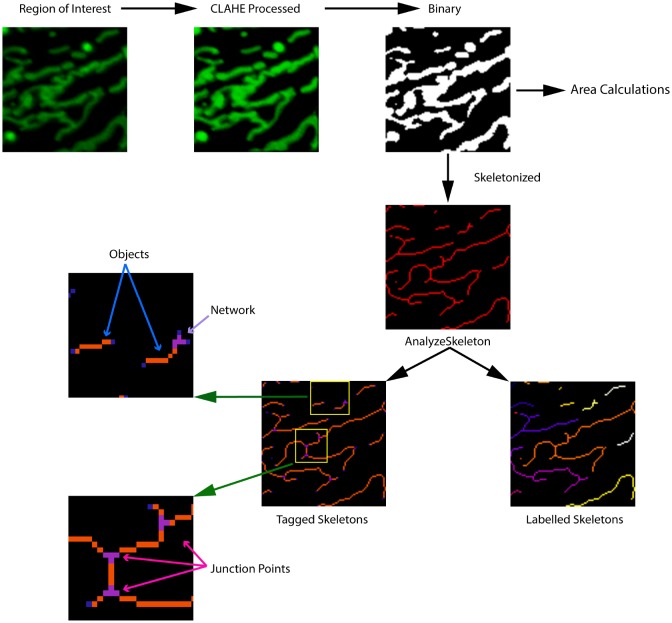
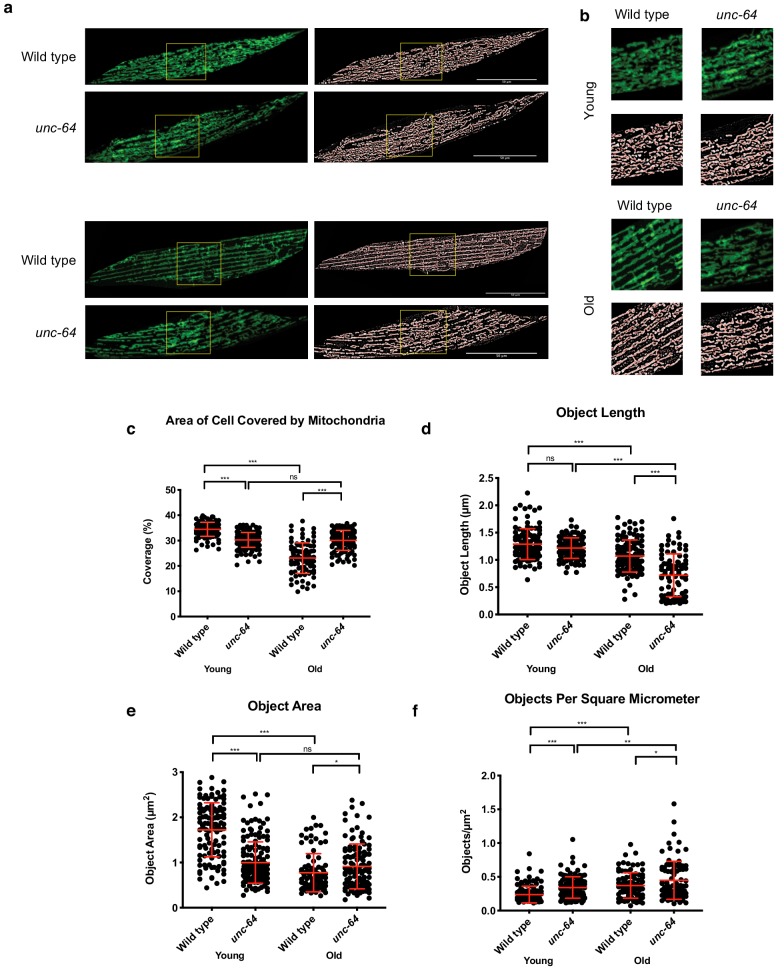
Figure 4—figure supplement 6. Effects of the unc-64 hypomorphic allele on muscle mitochondria morphology.

Figure 4—figure supplement 6.

(a) Representative pictures showing that unc-64(e246) mutants preserve mitochondrial morphology during aging. The mitochondrial backbone (red) is overlaid on binary images. TOMM-20aa1-49::GFP reporter labels muscle mitochondria in young (day 2) and old (day 12) wild type and unc-64(e246) animals (n = 3 independent trials, 28–45 cells were imaged per genotype for each time point per replicate). Scale bar represents 50 μm. (b) zoomed insets from a (yellow boxes). (c–f) Quantification of mitochondrial (c) coverage, (d) length and (e) measure of object area and (f) object per square unit area from TOMM-20aa1-49::GFP reporter in young (day 2) and old (day 12) wild type and unc-64(e246) animals. Data are represented as mean ± SD. P value: NS no significance, *<0.05, **<0.01, ***<0.001, ****<0.0001 relative to controls. Statistical significance was determined by two-tail t-test (n = 3 independent trials,~40 cells were quantified per genotype for each time point per replicate). Source data are provided in Figure 4–figure supplement 6—source data 1.
Figure 4—figure supplement 6—source data 1. Figure 4—figure supplement 6c-f Mitochondria network characteristics of muscle mitochondria in unc-64 mutants.
DOI: 10.7554/eLife.49158.030