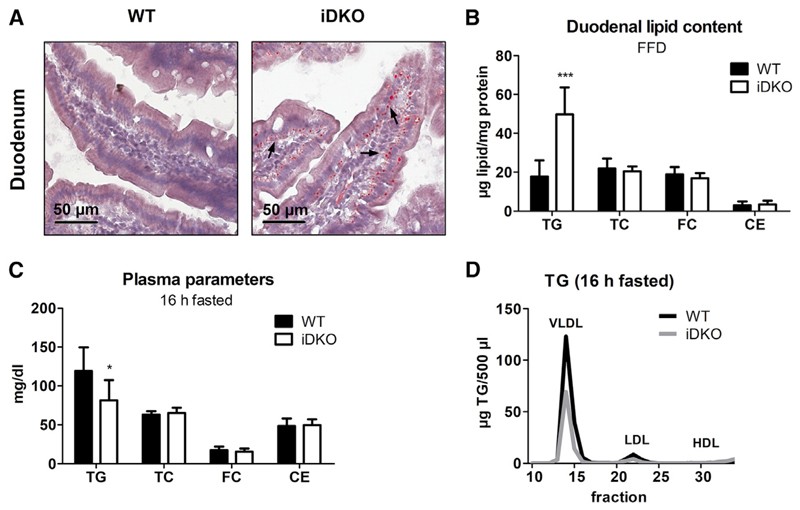
Figure 5. Persistent Increased Lipid Accumulation in the Intestine of iDKO Mice upon Restriction to Endogenous Lipid Sources.
(A and B) Histological (A) and biochemical lipid (B) analysis in the duodena of WT and iDKO mice (n = 6 or 7) after 5 weeks of FFD feeding (refed state).
(C and D) Plasma lipid parameters (C) and lipoprotein profiles (D) in 16 h fasted mice (n = 6–9) fed chow diet.
Data represent mean + SD. Magnification, 40×; scale bar, 50 μm. Arrows indicate cLDs on the basolateral pole of the enterocyte. *p < 0.05 and ***p ≤ 0.001. CE, cholesteryl esters; FC, free cholesterol; HDL, high-density lipoprotein; LDL, low-density lipoprotein; TC, total cholesterol; TG, triglycerides; VLDL, very low density lipoprotein.
See also Figure S6.

