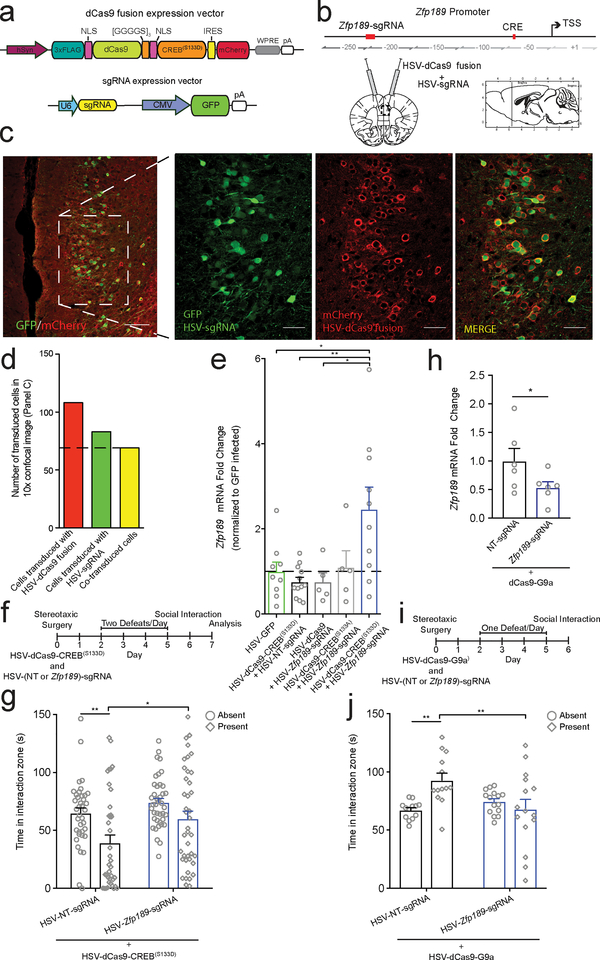
Fig 5. CRISPR-mediated, locus-specific modulation of Zfp189 with CREB or G9a bidirectionally controls resilient behavior.
a) Schematic of the CRISPR vectors. Variable dCas9 functional moiety in orange. Variable gene-targeting single guide RNA (sgRNA) in yellow. b) Location of Zfp189-targeting sgRNA binding site relative to other features in the Zfp189 promoter (in red). CRISPR vectors were packaged in HSV and delivered as a viral cocktail bilaterally to PFC. Hashed box denotes field of confocal imaging for Panel C, left. c) Immunohistological staining shows high degree of colocalization of HSV-sgRNA expression vector (GFP) and HSV-dCas9 fusion expression vector (mCherry) in PFC neurons. Left: 10x objective, scale bar = 100 μm. Right: 20x objective, scale bar = 50 μm. Repeated with similar results in three animals. d) Quantification of virus colocalization. e) CRISPR-mediated targeting of active, pseudo-phosphorylated CREB(S133D) to Zfp189 is sufficient to increase mRNA expression in PFC relative to HSV-GFP, un-targeted dCas9-CREBS133D, and dCas9 with no functional domain targeted to Zfp189 (Kruskall-Wallis test, χ2(5) = 10.27, p = 0.036, n=9,12,5,5,19 mice, two-tailed Mann-Whitney post-test p = 0.035, p = 0.004, and p = 0.040 respectively). Targeting dominant negative CREB(S133A) to Zfp189 has no effect. f) Experimental timeline to determine effect of CRISPR-mediated placement of CREB at the Zfp189 promoter in PFC neurons. g) Pro-resilient effects of CRISPR-dependent CREB-Zfp189 interactions. dCas9-CREBS133D delivered with Zfp189-targeting sgRNA increases time in the interaction zone when a target mouse is present relative to dCas9-CREBS133D with non-targeted (NT) sgRNA (Mixed model ANOVA, virus F1,76 = 6.235, p = 0.015, n=38,40 mice, Bonferroni post-test p < 0.05). h) Targeting dCas9 with G9a to the Zfp189 promoter reduces Zfp189 expression (two-tailed t test, t = 2.835, p = 0.037, n=6 mice). i) Experimental timeline to determine effect of CRISPR-mediated localization of G9a to the Zfp189 promoter in PFC neurons. j) Pro-susceptible effects Zfp189-targeted repression with G9a. dCas9-G9a delivered with Zfp189-targeting sgRNA decreases time in the interaction zone when a target mouse is present relative to dCas9-G9a with non-targeted (NT) sgRNA (Mixed model ANOVA, interaction F1,26 = 9.844, p = 0.0042, n=13,15 mice, Bonferroni post-test p < 0.01). *p < 0.05, **p < 0.01. Bar graphs show mean ± SEM.

