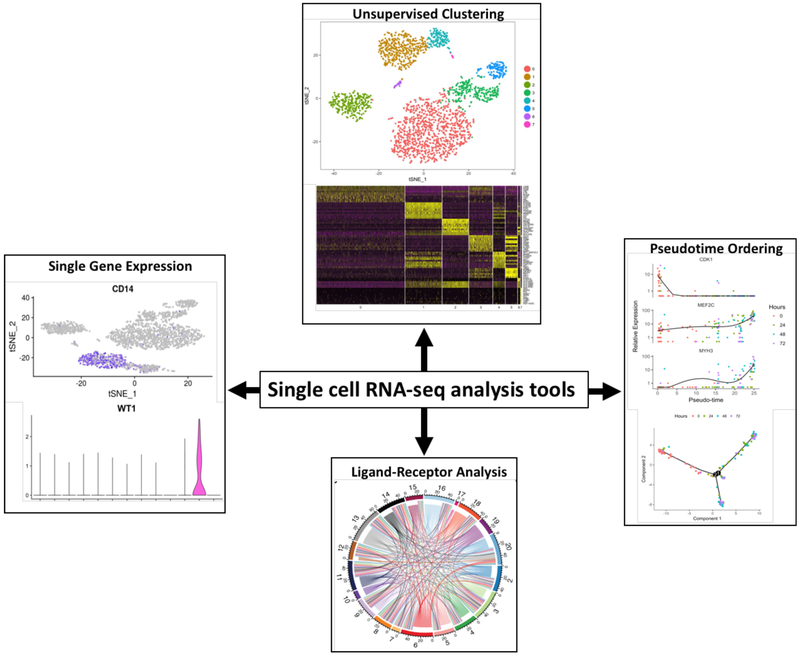
Figure 1. An example of single cell RNA-seq data analysis tools.
Unsupervised clustering of data and visualization using t-stochastic nearest neighbor embedding (tSNE) or heatmaps. Single gene expression using the Seurat FeaturePlot and VlnPlot functions.40 Pseudotime ordering using the Monocle.21 Ligand-receptor interactions visualized using Circos plot.41

