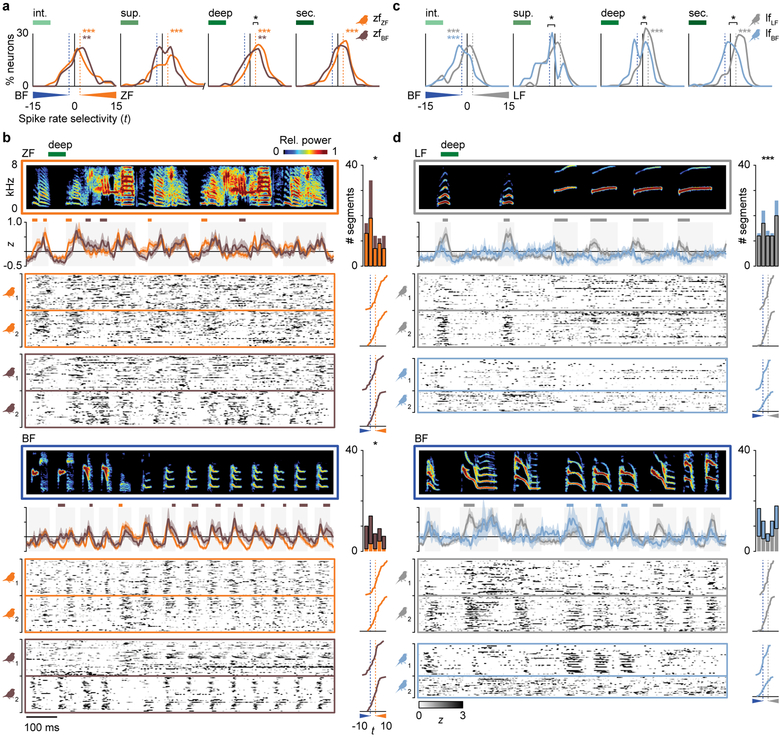
Fig. 3.
Song selectivity and population response dynamics are experience-dependent. a, Distributions of selectivity for ZF versus BF songs in zfZF birds (orange; n = 149, 181, 270, 197 neurons per AC region) and zfBF birds (brown; n = 73, 80, 136, 250 neurons per region). In zfZF birds, all regions had higher spike rates to ZF songs. In zfBF birds, the superficial and secondary regions exhibited no difference between songs, and selectivity in the deep region was shifted toward BF songs compared to normal birds. Colored stars indicate a significant response difference between song types within neurons (repeated-measures ANOVAs with bird identity as a covariate), black bars show the separation between distribution means, and black stars indicate a difference in selectivity between groups (ANOVAs with bird identity as a nested covariate). b, Spectrograms (0–8 kHz) of ZF (top) and BF (bottom) song segments plotted above deep-region pPSTHs (mean ± 95% C.I.) and neurograms (z-scored single-neuron PSTHs) from two birds in each group (n = 40 randomly selected neurons per bird). Colored lines above pPSTHs indicate sustained differences (≥10 ms) between groups, and bar graphs to the right show the number of segments in each ZF or BF stimulus that evoked a greater pPSTH in zfZF (orange) or zfBF (brown) birds (two-sided paired t-tests, n = 5 songs for each species). Traces to the right of neurograms show the selectivity of each respective neuron (dashed lines are t = ±1.96). c, Same as in a, but showing distributions of spike rate selectivity for LF versus BF songs in lfLF birds (gray, n = 164, 48, 224, 208 neurons per AC region) and lfBF birds (light blue, n = 133, 23, 75, 190 neurons per region). Both groups had greater responses to BF song in the intermediate region, but only lfLF birds had greater responses to LF songs in the deep and secondary regions. d, Same as in b, but showing spectrograms of LF and BF songs and deep-region pPSTHs and randomly selected neurograms from lfLF birds (n = 40 neurons per bird) and lfBF birds (n = 35 and 23 neurons per bird). For b and d, pPSTHs and neurograms were shifted in time by the average response latency of paired groups (zfZF and zfBF, 15 ms; lfLF and lfBF, 22 ms).
*P < 0.05, **P < 0.01, ***P < 0.001.

