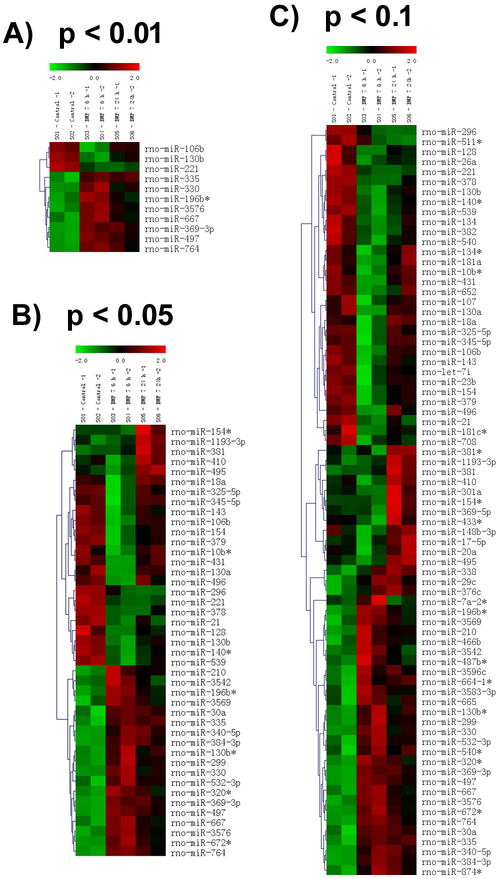
Fig. 1. Cluster diagram showing miRNAs differentially regulated by BMP-7 in cultured sympathetic neurons.
The columns are clustered based on experimental conditions, with rows showing the individual miRNA transcripts. The 6 columns in each panel represent 2 control samples, 2 samples from cultures exposed to BMP-7 for 6 h and 2 samples from cultures exposed to BMP-7 at 24 h. The relative expression of the miRNAs is shown on a color scale where red represents the highest level of upregulation and green represents the lowest level of downregulation at different time points. Statistical significance was assessed by one-way ANOVA, followed by Tukey’s test. Panel A, B and C show the miRNAs altered at p<0.01, p< 0.05, and p< 0.1 respectively.

