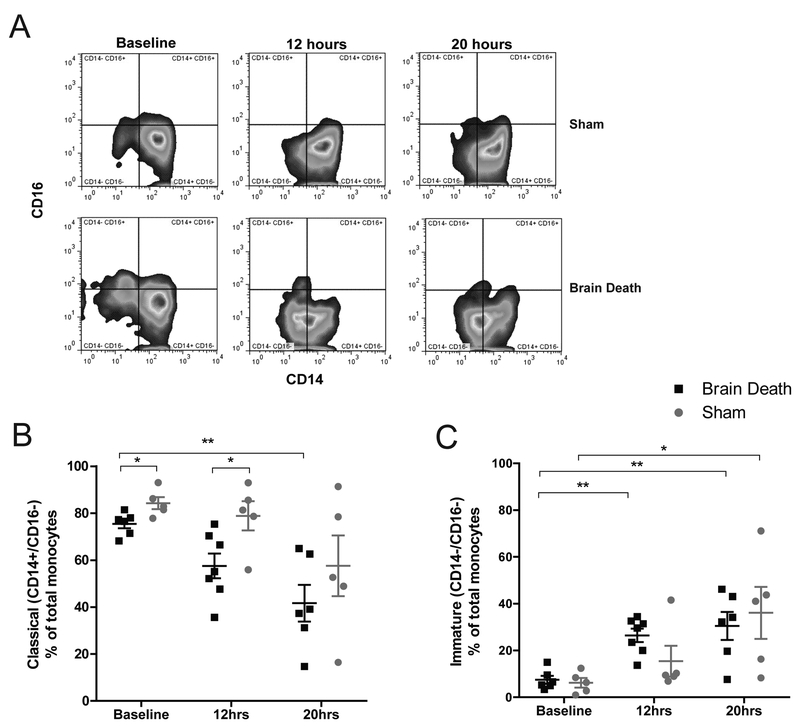
Figure 3. Examination of monocyte phenotype.
(A) Representative flow plots of monocyte phenotype observed in BD and sham animals at baseline, 12, and 20 hours according to CD14 ×CD16 staining-profile. (B) The percentage of classical (CD14+ CD16-) monocytes was significantly lower in BD animals at 20 hours compared to baseline; BD values are also significantly lower at baseline and 12 hours compared to sham at the same time points. Classical monocytes in sham animals at 20 hours were lower than baseline, but the difference did not attain statistical significance. (C) Compared to baseline, the percentage of immature (CD14- CD16-) monocytes was significantly higher in BD animals at 12 hours and in both sham and BD animals by 20 hours, with no statistical differences detected between groups at the same time points. BD (n=6), sham (n=5), data are presented as average, +SEM. Time-point values within each group were compared by 1-way repeated measures ANOVA with Bonferonni correction. Differences between groups at each time-point were compared by unpaired T-test. **p<0.01, *p<0.05.

