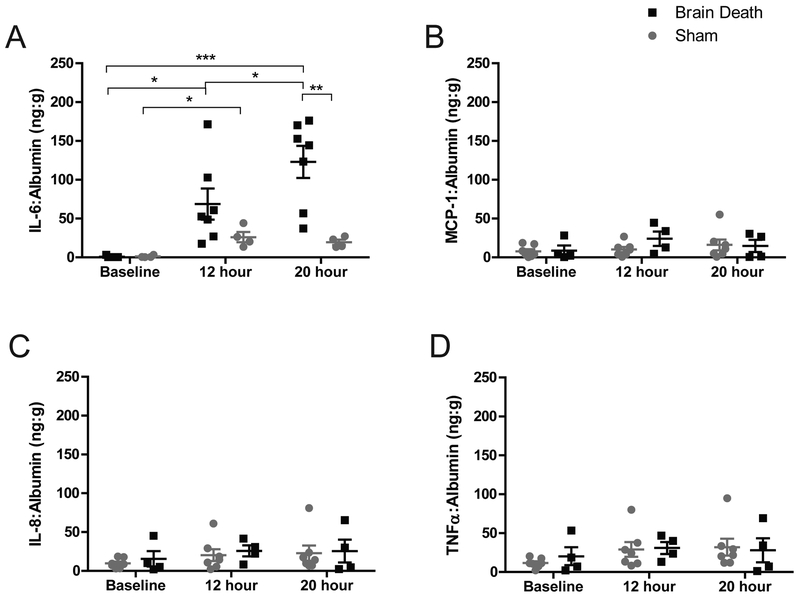
Figure 5. Circulating plasma cytokines levels.
(A) Circulating IL-6 significantly increased from baseline to 12 hours in both groups. In BD, IL-6 was also significantly elevated at 20 hours compared to baseline, 12 hours, and also compared to sham at the same time-point. Modest increases were observed in (B) MCP-1, (C) IL-8, (D) TNF? in both groups by 20 hours, but changes did not attain statistical significance between groups or time-points. BD (n=7), Sham (n=4), data are presented as average values normalized to albumin, +SEM. Time-point values within each group were compared by 1-way repeated measures ANOVA with Bonferonni correction. Differences between groups at each time-point compared by unpaired T-test. ***p<0.001, **p<0.01, *p<0.05.

