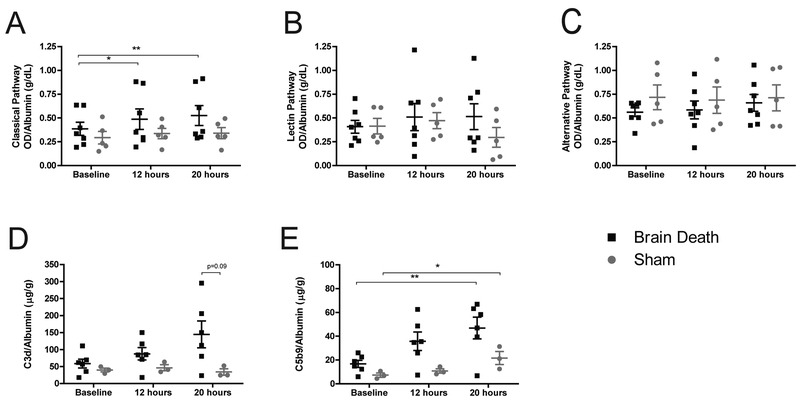
Figure 6. The role of complement activity.
(A) Classical complement pathway showed a significant increase in BD animals at 12 and 20 hours compared to baseline, with no comparable increase in sham animals. There were no significant differences between sham and BD values at each time-point. (B) The lectin and (C) alternative pathways of complement activation showed no significant change between groups or time-points. (D) Soluble C3d increased in BD over time, but did not reach statistical significance. (E) Soluble C5b-9 significantly increased in both BD and sham animals at 20 hours compared to baseline. Differences between groups did not reach statistical significance. A-C, BD (n=7), sham (n=5), data presented is average background-subtracted optical density (OD) normalized to albumin, +SEM. D-E: BD (n=6), sham (n=3), data presented is average value normalized to albumin, +SEM. Time-point values within each group were compared by 1-way repeated measures ANOVA with Bonferonni correction. Differences between groups at each time-point were compared by unpaired T-test. *p<0.05, **p<0.01

