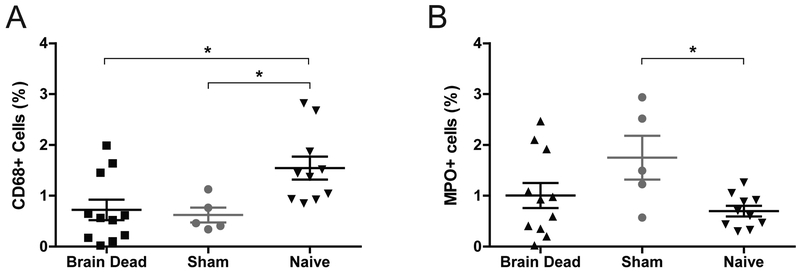
Figure 9. Immunohistochemistry CD68 and MPO.
(A) CD68 and (B) MPO in renal biopsies collected after 20-hours from sham and BD animals compared to biopsies from naïve animals. Both BD and sham presented signficantly fewer CD68+ macrophages and sham alone presented more MPO+ neutrophils compared to naïve, BD (n=11), sham (n=5), Naïve (n=10). Data presented as average values, +SEM. Differences between groups tested by 1-way ANOVA with Bonferonni correction. *p<0.05

