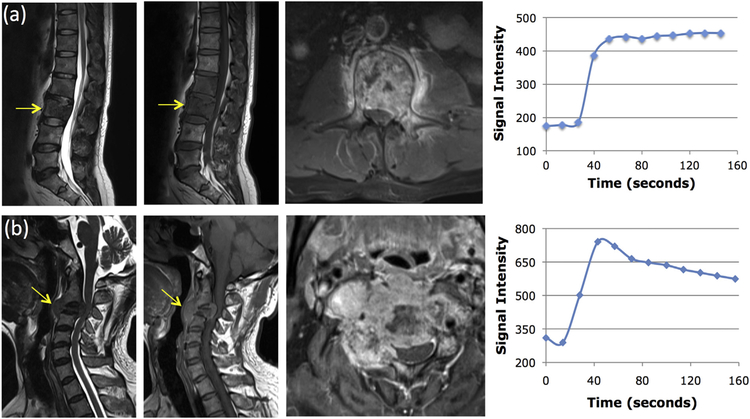
Fig. 1.
Two case examples. From left to right: the sagittal T2-weighted, T1-weighted, axial contrast-enhanced images, and the signal intensity time course measured from a region of interest (ROI) manually placed on the strongest enhancement area. Top panel: (a) A 45-year-old man with metastatic lung cancer, showing the plateau DCE kinetic pattern. Bottom panel: (b) A 55-year-old man with metastatic thyroid cancer, showing the wash-out DCE kinetic pattern.

