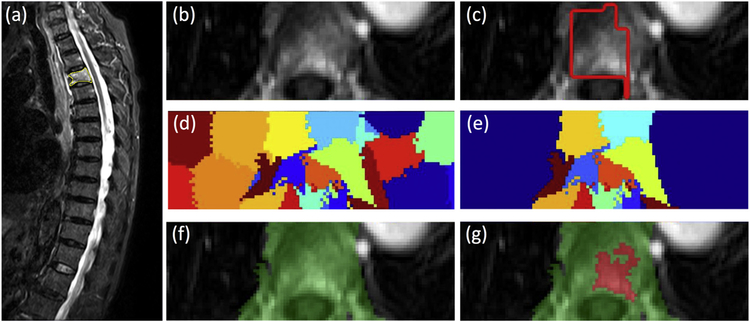
Fig. 3.
Identification and segmentation of the enhanced tumor on Axial DCE images based on the diseased segment drawn on Sagittal T2W images using the normalized cut algorithm. (a) Sagittal T2W image with marked diseased segment. (b) Axial view contrast-enhanced image. (c) The diseased segment in yellow in (a) is transferred to the axial image, shown as red box. (d) The clusters generated using the normalized cut. (d) The clusters containing any part of the red box ROI. (f) The vertebral region combining all remaining clusters. (g) The enhanced tumor lesion (in red) is generated by region growing within the green field. (For interpretation of the references to color in this figure legend, the reader is referred to the web version of this article.)

