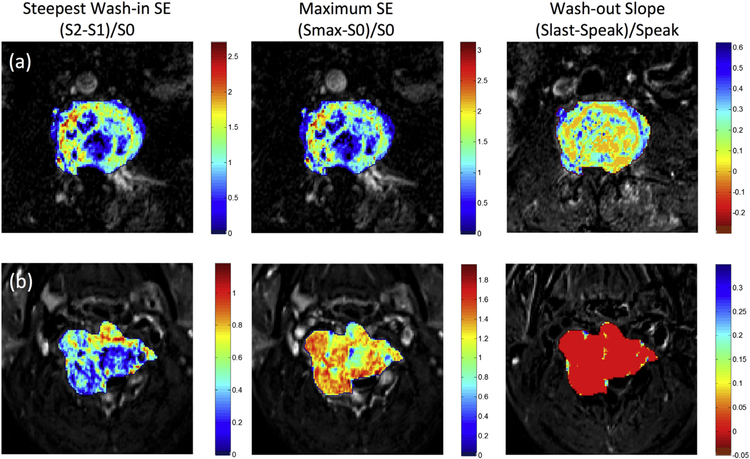
Fig. 4.
The generated DCE maps from the two case examples shown in Fig. 1 for (a) metastatic lung cancer and (b) metastatic thyroid cancer. The map is generated using the equation for all voxels, but only the voxels within the tumor ROI are shown by color according to the color maps. The entire thyroid cancer shows a clear wash-out pattern in red color; in contrast, the lung cancer mainly shows the plateau pattern in orange to green color. (For interpretation of the references to color in this figure legend, the reader is referred to the web version of this article.)

