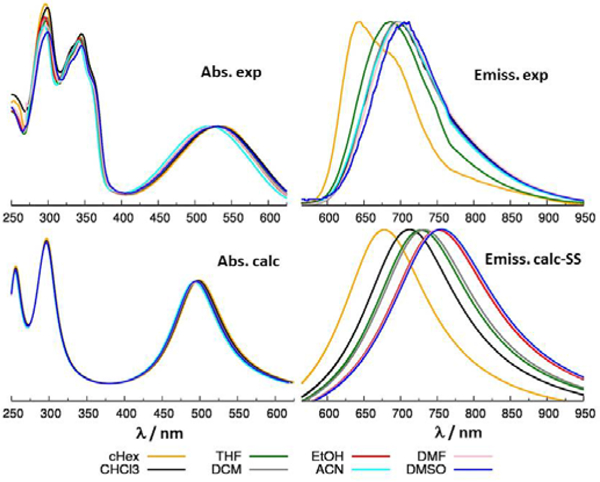
Fig. 5.

Comparison between computed (bottom) and experimental (top) absorption (left) and emission (right) spectra of TPT. Computed results from TD-CAM-B3LYP/6-31G* calculations, solvent described with PCM in the SS formalism. To facilitate the comparison with experiment, computed vertical excitations are broadened with a Lorentzian linewidth of 0.4 eV.
