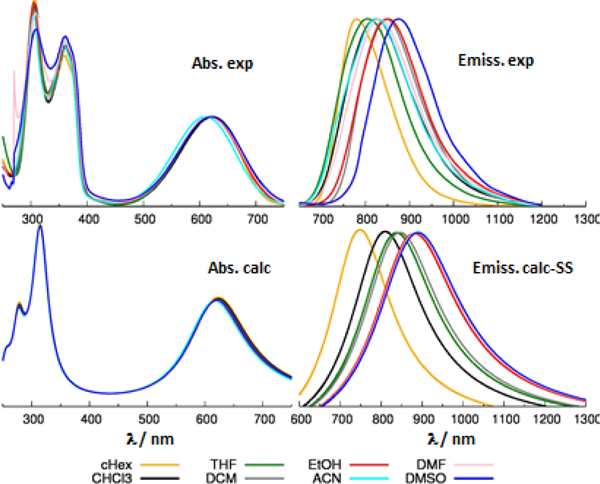
Fig. 6.

Comparison between computed (bottom) and experimental (top) absorption (left) and emission (right) spectra of TTzT. Computed results from TD-CAM-B3LYP/6-31G* calculations, solvent described with PCM in the SS formalism. Computed emission energies shifted by 0.2 eV, see the discussion in the text. To facilitate the comparison with experiment, computed vertical excitations are broadened with a Lorentzian linewidth of 0.4 eV.
