1.
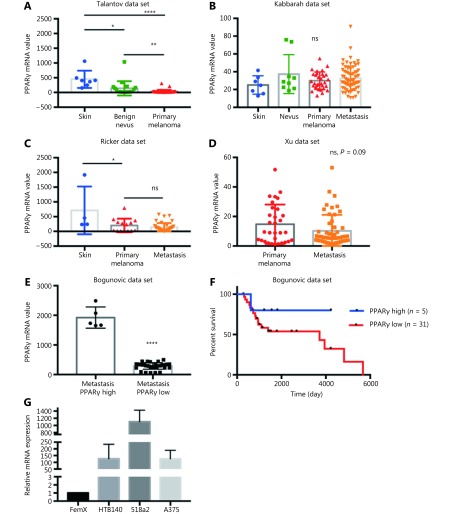
Expression of PPARγ receptor in melanoma. Relative expression levels of PPARγ in melanoma tumors included in (A) GSE318922, (B) GSE4651723, (C) GSE755324 and (D) GSE840125 datasets. Values represent mean ± SD, * P < 0.05, ** P < 0.01, *** P < 0.001, **** P < 0.0001, One-way ANOVA with Dunett’s multiple comparisons test. (E) High and low PPARγ expression in metastatic melanoma from dataset GSE19234 26, ****P < 0.0001, unpaired t test. (F) Survival curves for 36 metastatic melanoma patients with tumors expressing highest (n = 5) and lowest (n = 31) PPARγ levels calculated using Kaplan-Meier analysis. (G) Relative mRNA levels of PPARγ in melanoma cell lines measured by qRT-PCR. Values represent mean ± SEM of three independent experiments.

