5.
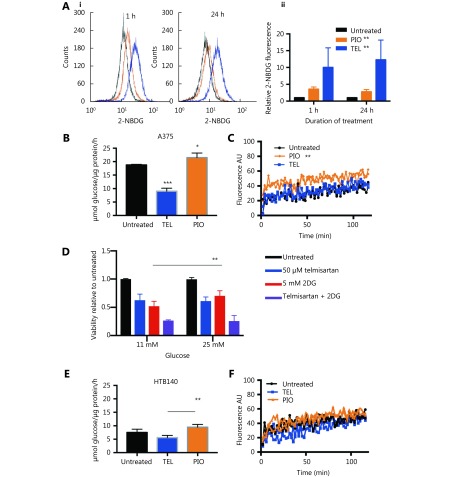
Telmisartan alters melanoma cell bioenergetics. (A) Representative graphs (i) and quantification (ii) of 2-NBDG uptake in A375 cells after 1 h or 24 h treatment with 50 μM telmisartan or pioglitazone, measured by flow cytometry. Values represent mean ± SD, One-way ANOVA, **P < 0.01, n = 3. Glucose consumption in (B) A375 cells and (E) HTB140 cells after 24 h treatment with 50 μM telmisartan or pioglitazone. Values represent mean ± SD, * P < 0.05, ** P < 0.01, *** P < 0.001, individual comparisons by unpaired t-test, n = 3. Lactate excretion in (C) A375 cells and (F) HTB140 cells after treatment with 50 μM telmisartan or pioglitazone, measured in extracellular acidification assay, where fluorescence signal correlates with lactate production, n = 2, linear regression analysis. (D) MTT viability assay of A375 cells cultured in regular RPMI (11 mM glucose) or glucose enriched (25 mM) RPMI in the presence of 50 μM telmisartan, 5 mM 2DG or the combination. ** P < 0.0049, n = 3 in unpaired t-test.

