2.
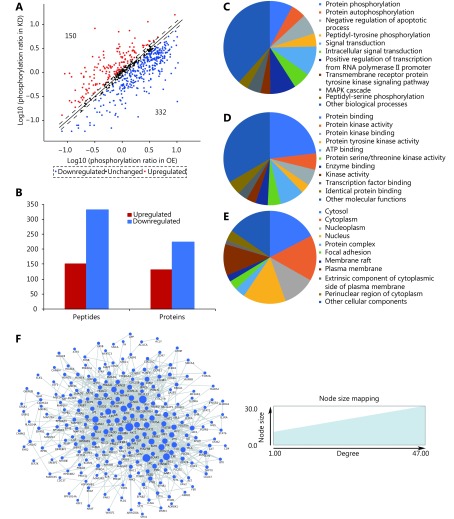
Characterization of differentially expressed phospho-proteins in cPLA2α-knockdown and cPLA2α-overexpressing HepG2 cells. (A) For each phosphorylation site analyzed, the ratio (in logs) of phosphorylated to unphosphorylated protein in KD cells was plotted against the same ratio (in logs) in OE cells. Each phosphorylation site of which ratio was > 1.18 or < 0.85 was marked as a red or blue plot, respectively. Otherwise, the sites were marked as black plots. (B) The bar chart demonstrated that 150 phosphorylation sites in 130 proteins were upregulated and 332 phosphorylation sites in 224 proteins were downregulated in KD cells when compared to OE cells. (C-E) Gene oncology analysis of differentially expressed phosphoproteome in terms of biological process (C), molecular function (D) and cellular component (E). (F) The PPI network of differentially expressed phosphoproteome and their interactions were represented as nodes and edges. The node size reflected the indicated interaction degree.

