3.
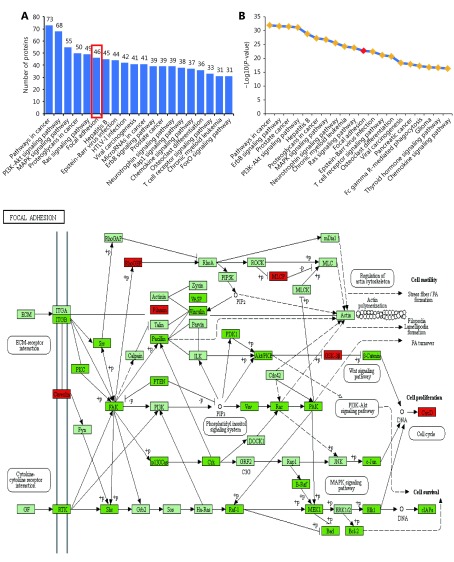
KEGG pathway analysis reveals the enrichment of FA pathway in differentially expressed phosphorylated proteins. (A, B) The top 20 enriched signaling pathways of differentially expressed phosphorylated proteins. X axis, KEGG term; (A) Y axis, number of phosphorylated proteins; (B) Y axis, negative logarithm (-log10) of P-value. The red frame (A) and rhombus (B) represented the focal adhesion pathway. (C) The KEGG pathway map of focal adhesion. Red rectangles indicated the upregulated phosphorylated proteins; dark green rectangles indicated the downregulated phosphorylated proteins; and aqua rectangles indicated the unchanged phosphorylated proteins.

