5.
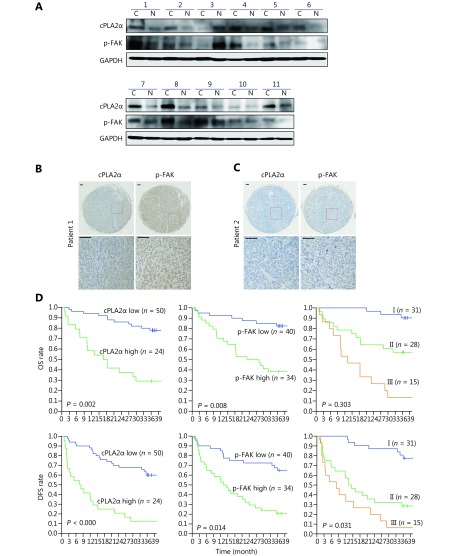
Expression of cPLA2α and p-FAK in HCC samples and their correlation with clinical prognosis. (A) Western blot analysis of cPLA2α and p-FAK expression in 11 paired cancer tissues (C) and adjacent noncancerous tissues (N). (B, C) Representative images (upper, 50 ×; lower, 200 ×) of cPLA2α and p-FAK expression by immunohistochemistry. (B) High expression of both cPLA2α and p-FAK; (C) low expression of both cPLA2α and p-FAK. (D) Kaplan-Meier analyses of overall survival (OS) and disease-free survival (DFS) rate according to cPLA2α and p-FAK expression. I, cPLA2αLow/p-FAKLow; II, cPLA2αLow/p-FAKHigh and cPLA2αHigh/p-FAKLow; III, cPLA2αHigh/p-FAKHigh.

