3.
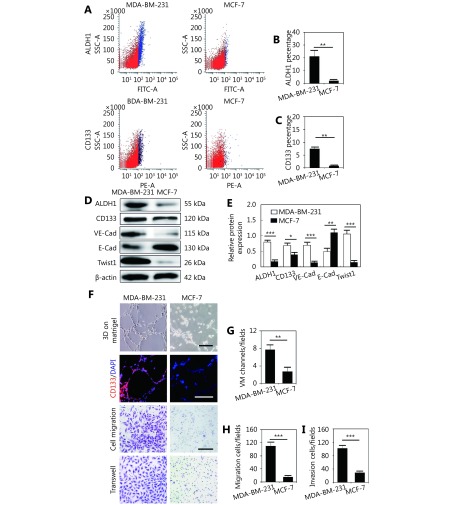
The difference of ALDH1 and CD133 expression in MDA-MB-231 and MCF-7 cells. (A) Representative FACS analyses of the ALDH1+ and CD133+ populations of MDA-MB-231 and MCF-7 cells. (B) Quantification of the ALDH1+ population in MDA-MB-231 and MCF-7 cells. (C) Quantification of the CD133+ population in MDA-MB-231 and MCF-7 cells. (D) Western blot showed the expression of ALDH1, CD133, VE-cadherin, E-cadherin, and Twist1 in MDA-MB-231 and MCF-7 cells. (E) Quantification of the expression of ALDH1, CD133, VE-cadherin, E-cadherin, and Twist1 in MDA-MB-231 and MCF-7 cells. (F) Matrigel cell culture shows that MDA-MB-231 cells formed more VM-like channels than MCF-7 cells on Matrigel. CD133 expressed in MDA-MB-231 cells lining VM. Cell migration and cell invasion analysis of MDA-MB-231 and MCF-7 cells. (G) Quantification of VM-like channels in MDA-MB-231 and MCF-7 cells. (H) Cell migration quantification of MDA-MB-231 and MCF-7 cells. (I) Cell invasion quantification of MDA-MB-231 and MCF-7 cells. The scale bar = 100 μm, and the error bar indicates the SD (standard deviation). ** means P < 0.01, *** means P < 0.001.

