1.
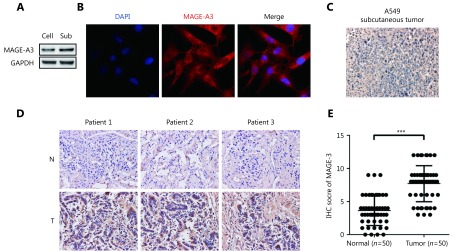
MAGE-A3 expression in A549 cells, subcutaneous tumors, and clinical lung cancer tissues. (A) Western blot analysis of MAGE-A3 in A549 cells (Cell) and subcutaneous tumors (Sub). (B) Immunofluorescence analysis of MAGE-A3 in A549 cells. IHC analyses of MAGE-A3 in A549 subcutaneous tumors (C) and in NSCLC patient tumors and adjacent tissues (D) (40 x). (E) Statistical analysis of MAGE-A3 expression in NSCLC patient tumors and adjacent tissues. *** P ≤ 0.001.

