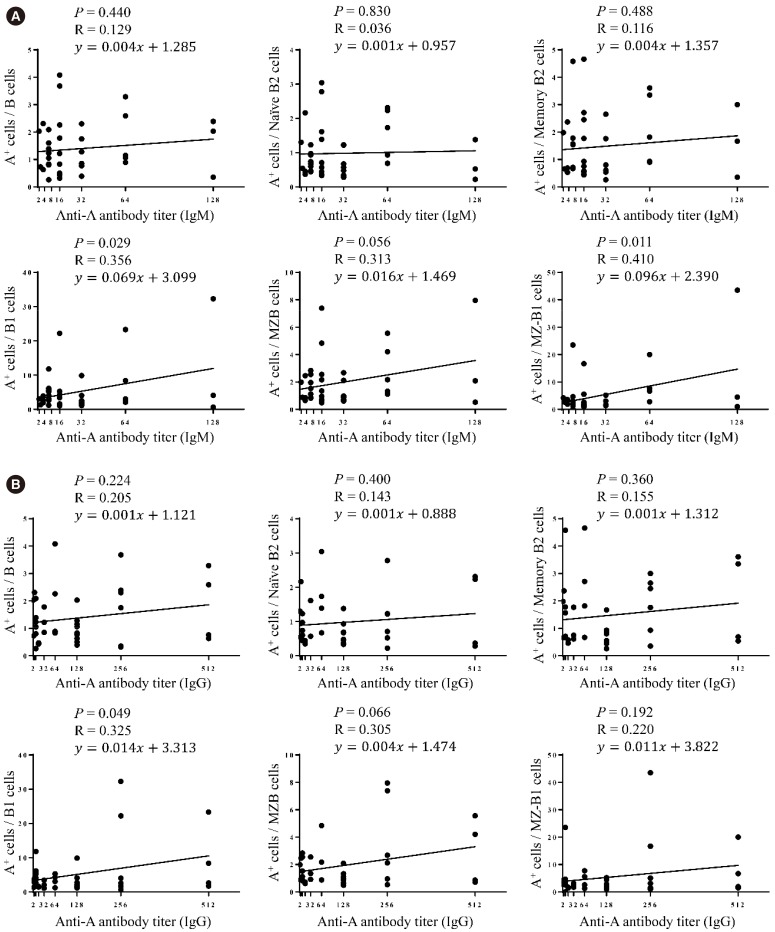
Fig. 3. The correlation between the frequency of each B cell subset and anti-blood group A IgM (A) and IgG (B) titer in the peripheral blood. The anti-A IgM titer was positively correlated with the frequency of CD20+CD27+CD43+CD1c− B1 cells and CD20+CD27+CD43+CD1c+ MZ-B1 cells (B1 cells, P=0.029, R=0.356; MZ-B1 cells, P=0.011, R=0.410). The anti-A IgG titer was positively correlated with the frequency of CD20+CD27+CD43+CD1c− B1 cells (P=0.049; R=0.325).
Abbreviations: MZB, marginal zone B cells; MZ-B1, marginal zone-B1 cells; R, Pearson correlation coefficient.

