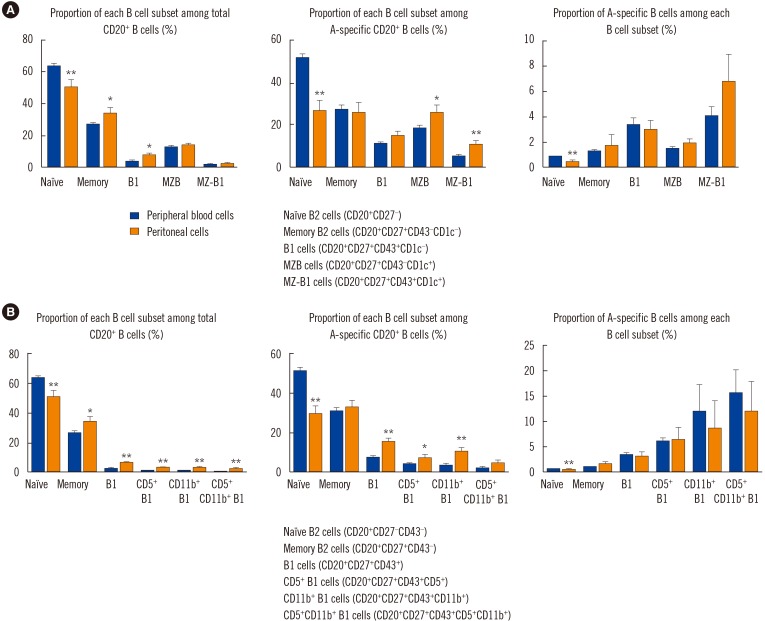
Fig. 5. B cell subsets and blood group A-specific B cells analyzed using the (A) CD27, CD43, CD1c and (B) CD43, CD5, CD11b classification methods. The proportion of each B cell subset within the total CD20+ B cell population (left panel), A-specific CD20+ B cells (middle panel), and blood group A-specific B cells among each B cell subset (right panel) were compared between peripheral blood and peritoneal cavity. The results are expressed as mean±SEM; N=15–30 per group.
*P<0.05, **P<0.01 comparing between peripheral blood and peritoneal cavity.
Abbreviations: MZB, marginal zone B cells; MZ-B1, marginal zone-B1 cells; SEM, standard error of the mean.

