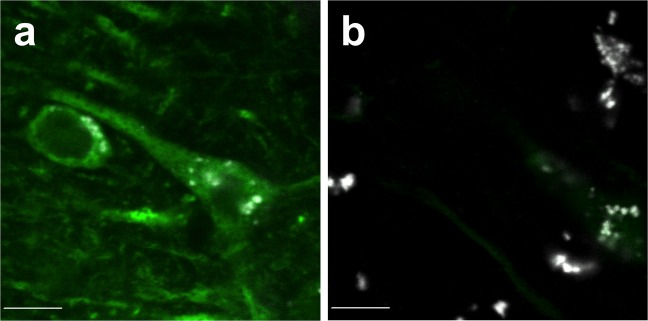
Fig. 2.
Micrographs of MAP2-IR in a representative pair of subjects. Micrographs are from a subject pair in LIP (filled circle in Fig. 3d). MAP2-IR (green) is significantly reduced in SZ subject (b) compared with matched NPC subject (a) after accounting for lipofuscin auto-fluorescence (grayscale). This difference is representative of the average 69.3% reduction in linear MAP2-IR value within LIP between diagnostic groups (shown as a reduction of 22.8% in loge[MAP2-IR] in Fig. 3a). Scale bars = 10 µm

