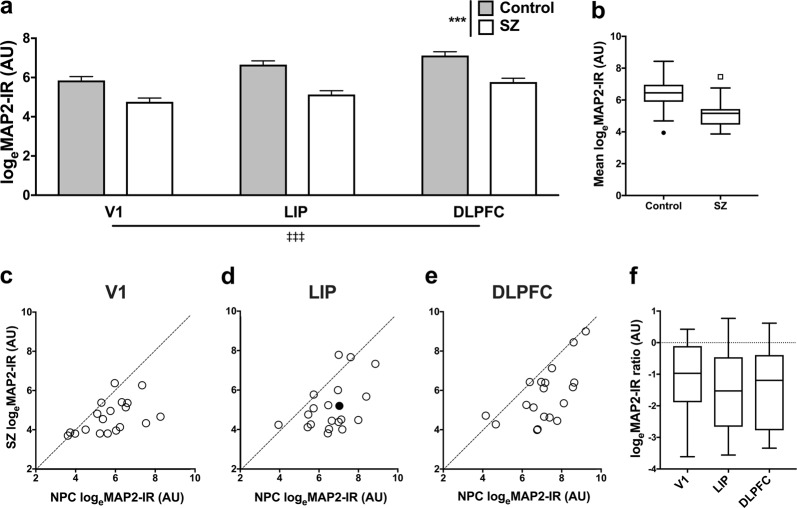
Fig. 3.
MAP2-IR is reduced uniformly in V1, LIP, and DLPFC of SZ patients compared with matched NPC subjects. a Estimated marginal means of loge(MAP2-IR) grayscale intensity levels by diagnostic group and cortical region. MAP2-IR differed significantly between groups and between regions, but there was not a significant diagnosis by region effect. N = V1: 19/20 (SZ/NPC); LIP: 20/20; DLPFC: 20/19. Error bars = SEM. ***p < 0.001 (diagnosis effect).  p < 0.001 (region effect). b Tukey boxplots by diagnostic group of loge(MAP2-IR) levels averaged across region. N = 18 subjects per group. c–e Control and SZ loge(MAP2-IR) levels in V1 (c), LIP (d), and DLPFC (e) shown by pair relative to a y = x line of no change. N = 18 pairs. Exemplary micrographs from a pair in LIP (filled dot in d) are shown in Fig. 2. f Tukey boxplots of loge(MAP2-IR) pairwise ratios (SZ:NPC) by region. N = 18 pairs per region. AU = arbitrary units

