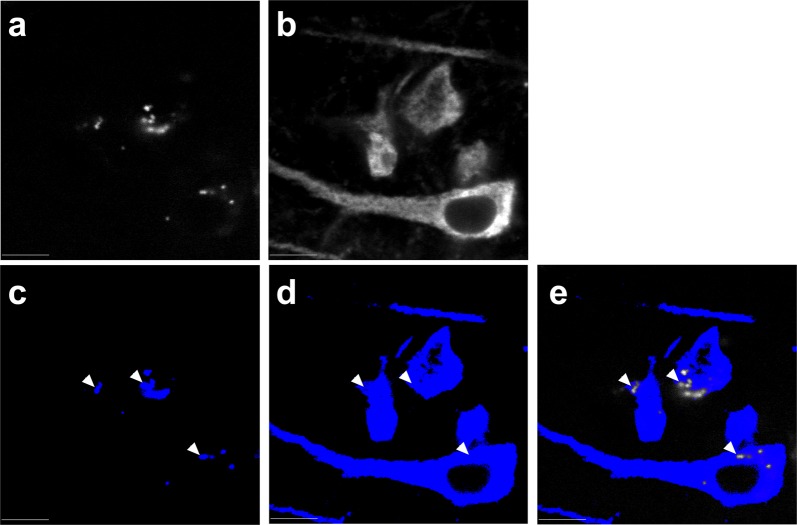
Fig. 6.
Elimination of lipofuscin auto-fluorescence from the MAP2-IR signal. Lipofuscin (a) was imaged by excitation at 405 nm with emissions collected at 668 nm. Signal was subjected to thresholding at a value manually selected from an intensity histogram to derive a binary mask (c). Ridler–Calvard thresholding was used to convert 647 channel emissions (b) into a mask (d), from which the 405 channel mask was subtracted to yield a final mask (e) for intensity analysis. Arrowheads indicate sites of mask subtraction. Scale bars = 10 µm

