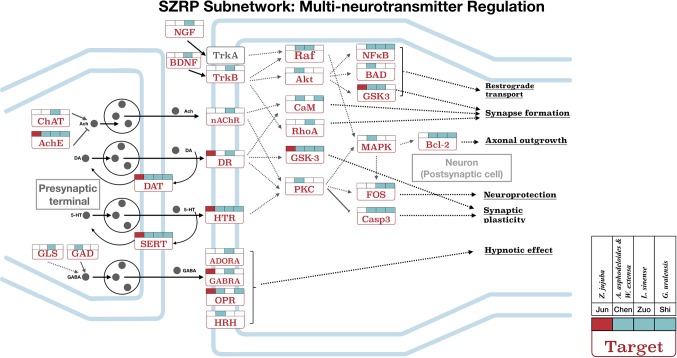
Figure 4.
The targeting subnetwork showing multi-neurotransmitter regulation at both pre-synapse and post-synapse for SZRP. Target names are shown in rectangles, and their full gene names can be found in Table S3 . The gray dots illustrate neurotransmitter/hormone. The colored flags above each target show the targeting pattern from four herbal groups of SZRP, where the Emperor’s (Jun) targets are labeled in red. The solid arrows in the figure mean directed actions, and dashed arrows represent intermediate genes abbreviated for better illustration.

