Figure 2.
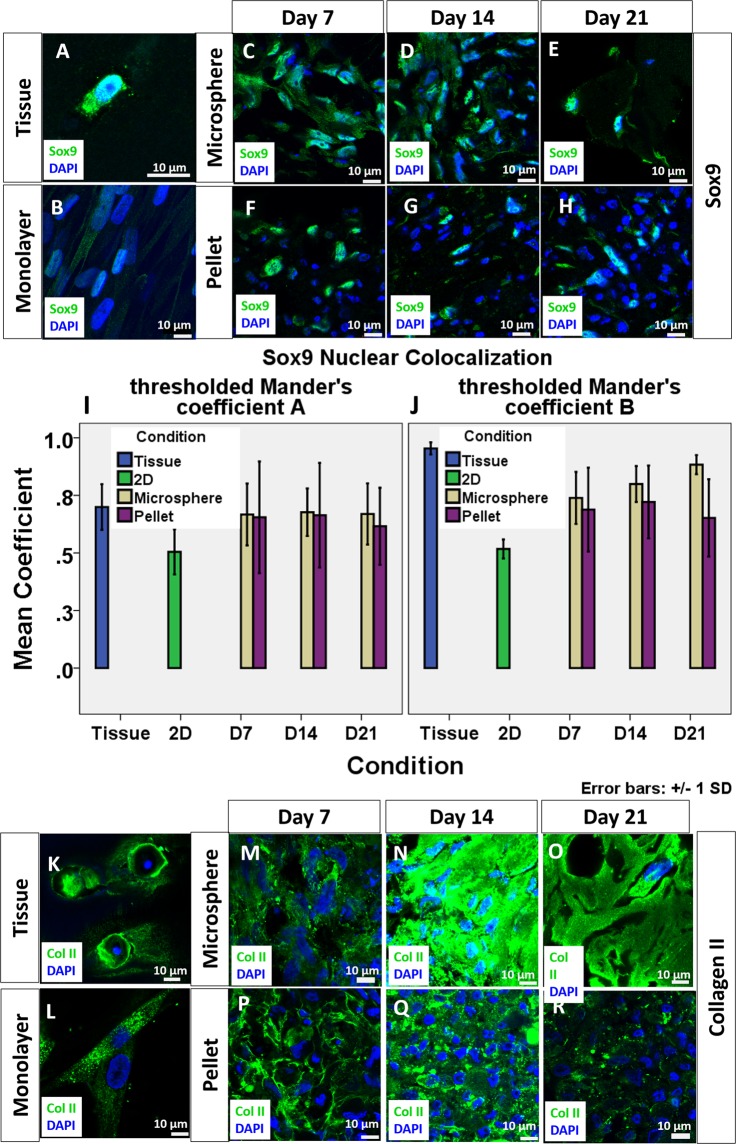
Expression of chondrogenic markers of chondrocytes in cartilage, monolayer culture, collagen microspheres and pellet at different time points. SOX9 expression in chondrocytes of OA cartilage specimen (A), monolayer cultured chondrocytes (B), chondrocytes collagen microspheres (C–E) and pellet (F–H). Green: SOX9; Blue: DAPI. Scale bar: 10 μm. The colocalization of Sox9 and DAPI was revealed as Manders’s Colocalization Coefficient (MCC). The coefficient is calculated as the fraction of Sox9 in compartment containing DAPI (I) and the fraction of DAPI in compartment containing Sox9 (J). Each reading is the mean from three independent experiments, each with 5 images. Collagen II expression of chondrocytes in OA cartilage specimen (K), monolayer culture chondrocytes (L), chondrocytes collagen microspheres (M–O) and pellet (P–R). Green: Collagen II; Blue: DAPI; Scale bar: 10 μm.

