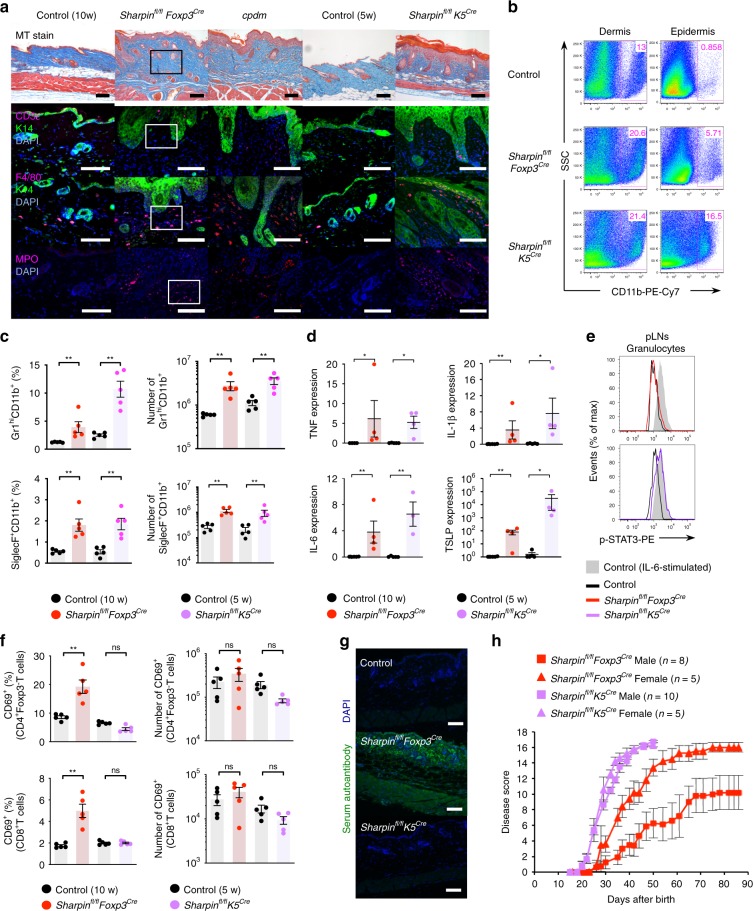
Fig. 4.
Distinct etiologies, autoimmunity in Sharpinfl/flFoxp3Cre or autoinflammation in Sharpinfl/flK5Cre, result in similar myeloid cell-dominant inflammatory outcomes. a Pathology underlying skin inflammation. Skin sections were subjected to Masson’s trichrome and immunofluorescence staining. The types of infiltrating immune cell were identified by staining with antibodies specific for CD3ε (T cells), F4/80 (macrophages), and MPO (neutrophils). Keratin14 (K14) was used as a structural marker of the epidermis. The outlined areas are magnified in Fig. 7f. Scale bars: 100 μm. b Percentage of skin-infiltrating CD11b+ cells. c Representative plots, percentages, and absolute numbers of eosinophils (CD11b+SiglecF+) and neutrophils (CD11b+Gr1hi) in the spleen in 6-week-old Sharpinfl/flK5Cre and 10-week-old Sharpinfl/flFoxp3Cre and respective control mice. n = 5 biologically independent animals. d Quantitative analysis of skin mRNA encoding inflammation-related cytokines. n = 4 biologically independent animals. e Histogram showing the presence of phosphorylated STAT3 in Gr1+ granulocytes isolated from secondary lymph nodes. As a positive control, cells were incubated for 15 min at 37 °C with IL-6 (30 ng/ml) prior to intracellular staining. f Percentage of activated CD69+ subsets in CD4+ or CD8+ T cells in secondary lymphoid tissues. n = 5 biologically independent animals. g Detection of skin-associated autoantibodies in serum. Scale bars: 100 μm. h Severity scores for spontaneous skin inflammation. Each score represents an average value from the indicated number of mice. Small horizontal lines indicate the mean (±s.e.m.). ns, p > 0.05; *p < 0.05; **p < 0.01. Two-tailed Mann–Whitney U-test was used for c–f. Data are representative of at least three independent experiments (a, b, e, g), or pooled from two independent experiments (c, d, f). Also, see Supplementary Fig. 4. Source data are provided in a Source Data file

