Fig. 1.
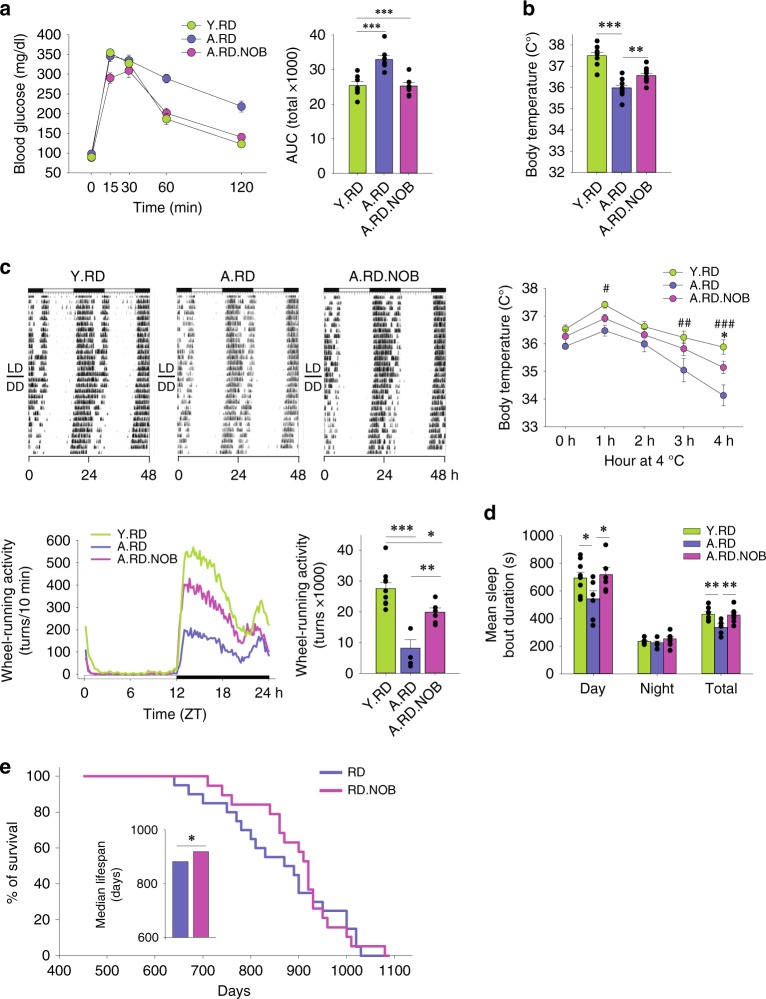
NOB improved physiological health and survival of aged mice under regular diet. a–d Young (Y) or aged (A) mice were fed with regular diet (RD) or regular diet with NOB (RD.N). a Glucose tolerance test and area under curve (AUC) (n = 10, 7, and 8 for Y.RD, A.RD, and A.RD.NOB, respectively). b Core body temperature (upper panel, n = 10) and cold tolerance (lower panel, n = 10, 7, and 5 for Y.RD, A.RD, and A.RD.NOB, respectively); *A.RD vs. A.RD.NOB; #A.RD vs. Y.RD; two-way ANOVA). c Wheel-running activity (WRA) analysis. Representative actograms (upper panels) are shown. Daily activity patterns (lower left, line graph) and daily averages (lower right, bar graph) are shown (ActiView) (n = 10, 5, and 6 for Y.RD, A.RD, and A.RD.NOB, respectively). d Mean sleep bout duration was analyzed with the PIEZO sleep analysis system (n = 9, 6, and 6 for Y.RD, A.RD, and A.RD.NOB, respectively). e Kaplan–Meier (KM) survival curves in 16-month-old mice fed with regular diet with or without 0.1% NOB supplement. Inset: median lifespan comparison. a–d *p < 0.05, **p < 0.01, ***p < 0.001, one-way ANOVA. e *p < 0.05, Log-rank and Mann–Whitney U-tests (see Supplementary Fig. 1h). Data are presented as mean ± SEM in bar and line graphs

