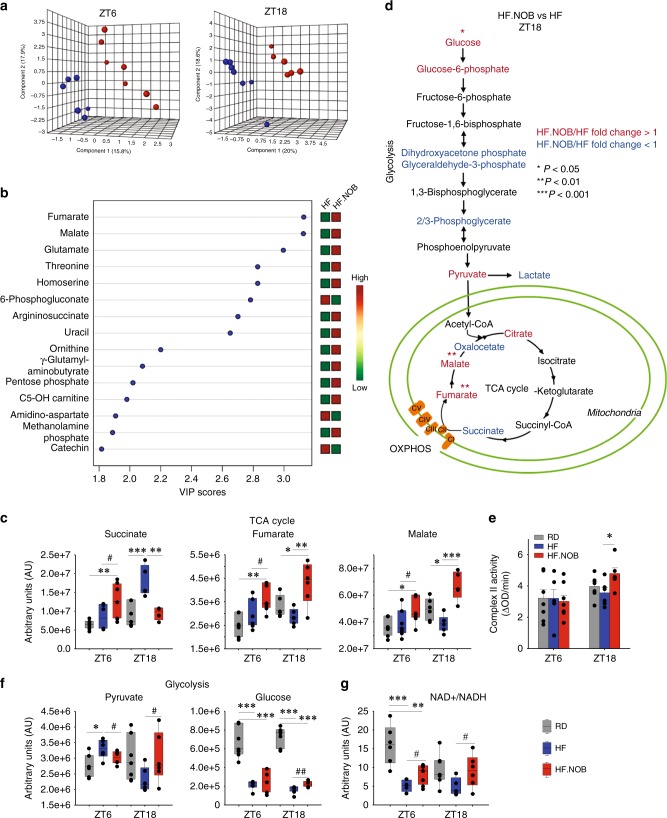
Fig. 6.
NOB regulates TCA and glycolysis flux. Aged skeletal muscle was subjected to unbiased metabolomic analysis. a, b PLS-DA analysis results are 3D plotted for ZT6 and ZT18, and VIP score plotting for overall are shown. Blue and red dots indicate individual HF and HF.NOB-fed mice (ZT6, n = 7 and 8 for HF and HF.NOB, respectively; ZT18, n = 7 and 6 for HF and HF.NOB, respectively). c TCA cycle metabolites in skeletal muscle (ZT6, n = 7, 7, and 8 for RD, HF, and HF.NOB, respectively; ZT18, n = 7, 7, and 6 for RD, HF, and HF.NOB, respectively). d Glycolysis and TCA pathway analysis between HF and HF.NOB in skeletal muscle at ZT18. Red and blue indicate fold change ≥ 1.1 and ≤ 0.9, respectively (n = 7 and 6 for HF and HF.NOB, respectively). e Complex II activity in isolated mitochondria from calf muscle were measured (ZT6, n = 7, 6, and 8 for RD, HF, and HF.NOB, respectively; ZT18, n = 6). f Glycolysis-related metabolites in skeletal muscle (ZT6, n = 7, 7, and 8 for RD, HF, and HF.NOB; ZT18, n = 7, 7, and 6 for RD, HF, and HF.NOB, respectively). g NAD+ /NADH in skeletal muscle (ZT6, n = 7, 7, and 8 for RD, HF, and HF.NOB, respectively; ZT18, n = 7, 7, and 6 for RD, HF, and HF.NOB, respectively). *p < 0.05, **p < 0.01, ***p < 0.001, one-way ANOVA; #p < 0.05, ##p < 0.01, t-test. Data are presented as mean ± SEM in bar graphs. For box-whisker plots, box edges correspond to 25th and 75th percentiles, lines inside the box correspond to 50th percentiles, and whiskers include extreme data points

