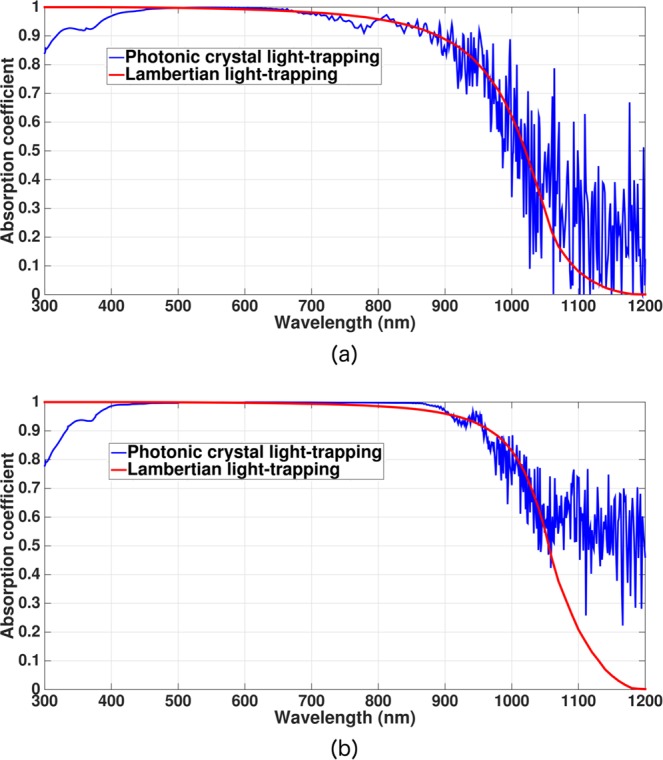
Figure 4.

Absorption spectra for (a) 5 μm and (b) 15 μm-thick inverted pyramid photonic crystal IBC solar cell over the 300–1200 nm wavelength range (blue curves). The 1100–1200 nm absorption is modeled following the details illustrated in the “Methods” section. Red curves correspond to the absorption spectra of the hypothetical Lambertian cells. In contrast to Lambertian cells and planar cells, high solar energy absorption in the 950–1200 nm spectral range due to multiple resonant absorption peaks is a signature of photonic crystal light-trapping.
