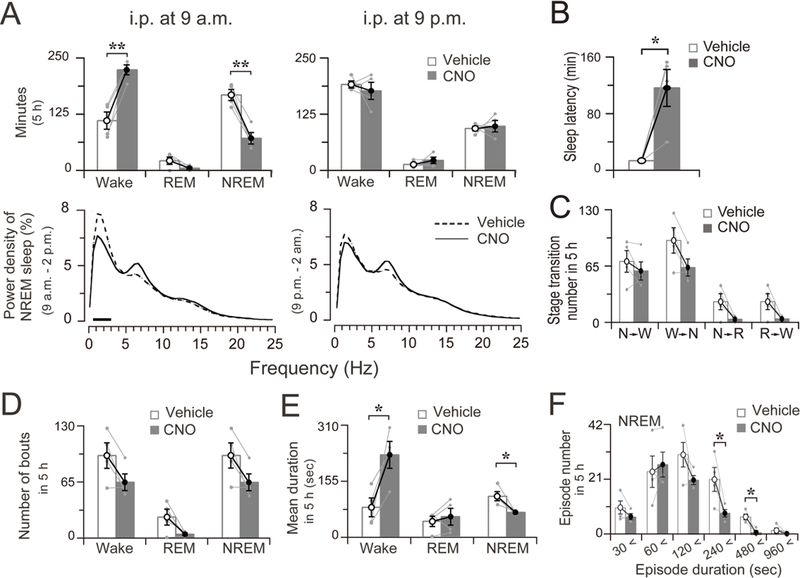
Figure 7. Five-hour sleep-wake profile after chemogenetic stimulation of the mesolimbic neurons.
A. Total time spent in wakefulness, REM and NREM sleep and EEG power density of NREM sleep during five hours after vehicle and CNO treatment at 9 a.m. or at 9 p.m. The horizontal bars indicate a statistical difference (P < 0.05) between CNO and vehicle control.
B. Sleep latency after vehicle and CNO treatment at 9 a.m.
C. Sleep-wake state transitions during five hours after vehicle and CNO treatment at 9 a.m.
D. Total number of wake, NREM, and REM bouts during five hours after vehicle and CNO treatment at 9 a.m.
E. Mean duration of wake, NREM, and REM bouts during five hours after vehicle and CNO treatment at 9 a.m.
F. Number of NREM sleep bouts at different ranges of episode duration in five hours after the administration of vehicle or CNO at 9 a.m.
Data are represented by mean ± SEM. *p < 0.05. Each pair of grey dots indicates data from one rat.

