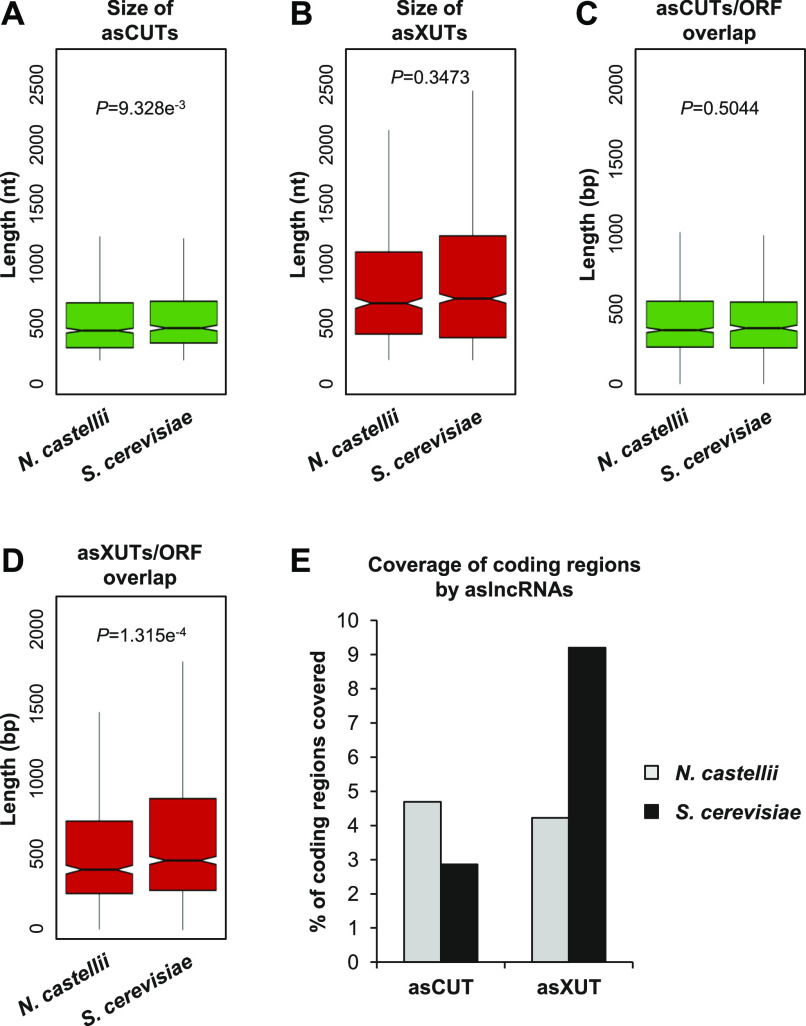
Figure 5. Expansion of the exosome-sensitive aslncRNAs transcriptome in N. castellii.
(A) Box plot of asCUTs size (nt) in N. castellii (n = 868) and S. cerevisiae (n = 535). For S. cerevisiae, all the <200-nt CUTs were removed from the analysis. The P-value obtained upon two-sided Wilcoxon rank-sum test is indicated. Outliers: not shown. (B) Same as above for asXUTs in N. castellii (n = 622) and S. cerevisiae (n = 1,152). (C) Box-plot of the overlap (bp) between asCUTs and the paired-sense ORF in N. castellii (n = 889) and S. cerevisiae (n = 574). For S. cerevisiae, all the <200-nt CUTs were removed from the analysis. The P-value obtained upon two-sided Wilcoxon rank-sum test is indicated. Outliers: not shown. (D) Same as above for asXUTs/ORF overlap in N. castellii (n = 674) and S. cerevisiae (n = 1,252). (E) Cumulative coverage of the coding regions by asCUTs and asXUTs in N. castellii (grey bars) and S. cerevisiae (black bars).

