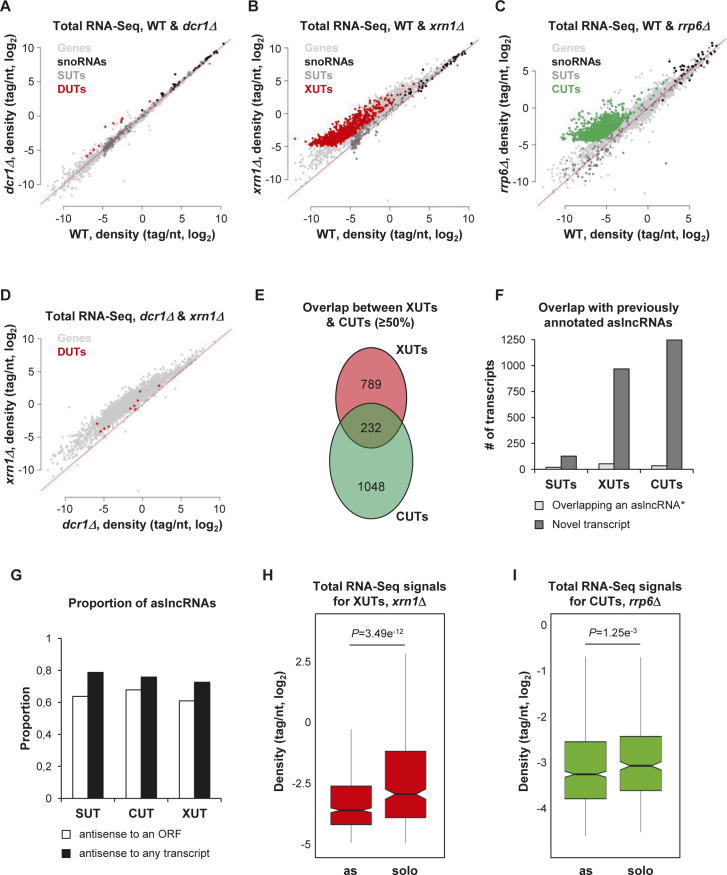
Figure S1. Annotation of novel aslncRNAs in N. castellii.
(A) Scatter plot of tag density for mRNAs (light grey), sn(o)RNAs (black), SUTs (dark grey), and DUTs (red) in the WT and dcr1Δ strains. Results are presented as log2 of density, expressed in tag/nt. The red line indicates no change (mutant/WT ratio = 1). (B) Scatter plot of tag density for mRNAs (light grey), sn(o)RNAs (black), SUTs (dark grey), and XUTs (red) in the WT and xrn1Δ strains. The data are presented as above. (C) Scatter plot of tag density for mRNAs (light grey), sn(o)RNAs (black), SUTs (dark grey), and CUTs (green) in the WT and rrp6Δ strains. The raw RNA-Seq data have been previously published (Alcid & Tsukiyama, 2016). The presentation of the results is as above. (D) Scatter plot of tag density for mRNAs (light grey) and DUTs (red) in the dcr1Δ and xrn1Δ strains. The results are presented as above. (E) Venn diagram showing the overlap (≥50%) between CUTs and XUTs. (F) Overlap (≥1 nt) between the SUTs, XUTs, and CUTs identified in this work and the 170 previously annotated aslncRNAs (Alcid & Tsukiyama, 2016). For each class lncRNAs, the number of transcripts overlapping ≥1 nt of a previously annotated aslncRNA (*) is represented as a light grey bar; the number of novel transcript is represented as a dark grey bar. (G) Proportion of SUTs, CUTs, and XUTs that are antisense (≥1 nt) to an ORF (white bars) or to any annotated transcript (black bars). (H) Box plot of densities (tag/nt, log2 scale) for the antisense and solo XUTs in xrn1Δ cells. The P-value (adjusted for multiple testing with the Benjamini-Hochberg procedure) obtained upon two-sided Wilcoxon rank-sum test is indicated. Outliers: not shown. (I) Same as above for the antisense and solo CUTs in rrp6Δ cells. The raw RNA-Seq data have been previously published (Alcid & Tsukiyama, 2016).

