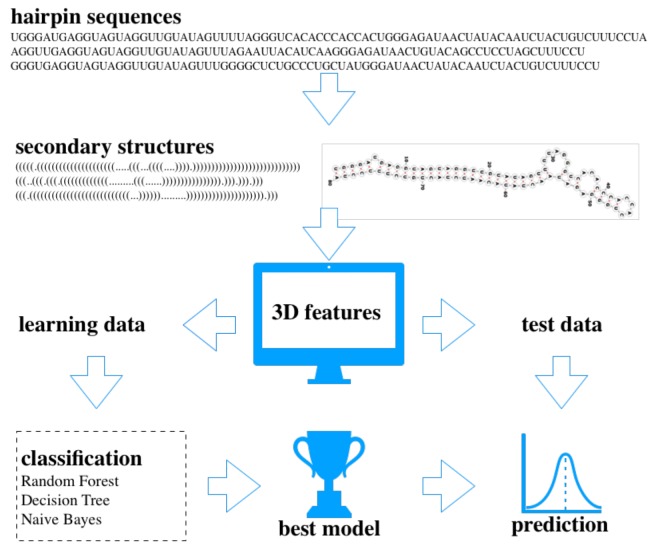
Figure 2.
The basic workflow of the analysis. Hairpin sequences were folded into their secondary structures and based on the state of the bases (bonded or nonbonded) for each hairpin 3D features were calculated. Learning datasets were used for classification analysis with 1000-fold Monte Carlo cross-validation and the best models with the highest accuracy scores were applied to the test datasets for prediction.

