Figure 5.
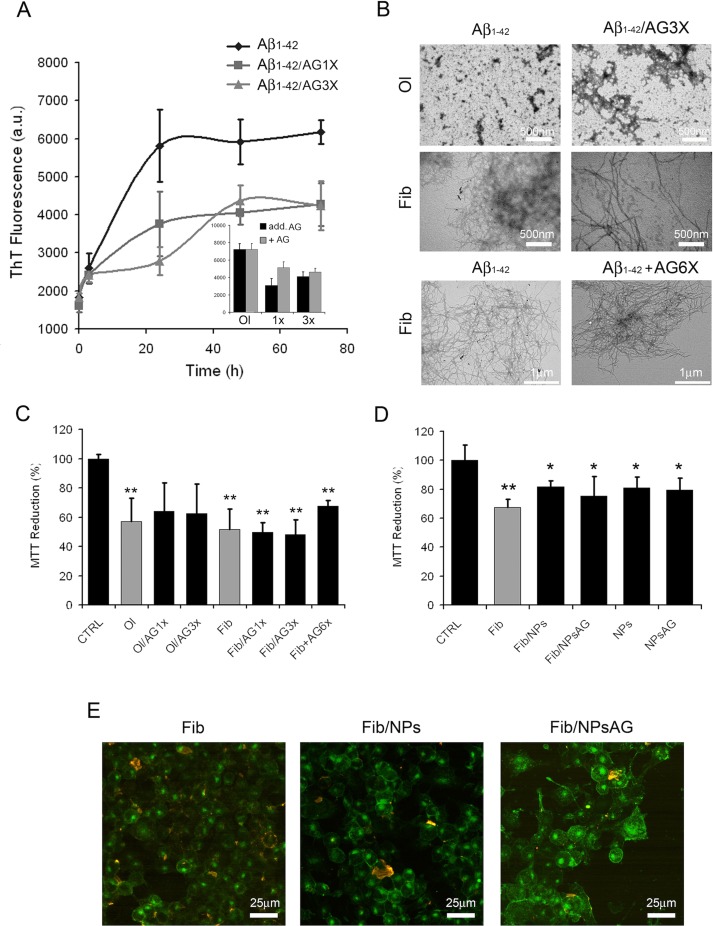
Effects of AG on Aβ1-42 aggregation process and resulting cytotoxicity. Aβ aggregation process followed by ThT fluorescence assay (A). The interference of AG with the ThT fluorescence assay was evaluated by comparing the emission fluorescence spectra intensity of Aβ1-42 aggregates with respect to when AG was added together to the probe or immediately after the probe (A, inset). TEM pictures taken from Aβ1-42 aggregation mixture after 24 and 72 h of incubation in the absence or in the presence of 3X-AG (B), first and second lines). TEM pictures taken from preformed Aβ fibrils 72 h aged and successively treated with 6X-AG. The scale bars are shown. Cell viability assessed by the MTT reduction assay (C–D). N2a cells treated for 24 h with 2.5 µM Aβ solution obtained at 24 and 72 h of aggregation time. Each sample was obtained in the absence or in the presence of 1X- or 3X-AG or AG NPs. For the MTT assay, preformed fibrils treated with 6X-AG were also tested (C). Error bars indicate the standard deviation of independent experiments carried out in triplicate. Statistical analysis was performed using Student’s t-test: *P < 0.05, **P < 0.01 versus untreated cells and *P < 0.05 versus treated cells with Aβ1-42 aggregates grown without AG. The Aβ fibrils grown both in the absence and in the presence of AG NPs or NPs bind to the plasma membrane. Z-projection of N2a cell images by Aβ1-42 immunostaining (red) and GM1 staining (green). The scale bars are shown (E).

