Figure 4.

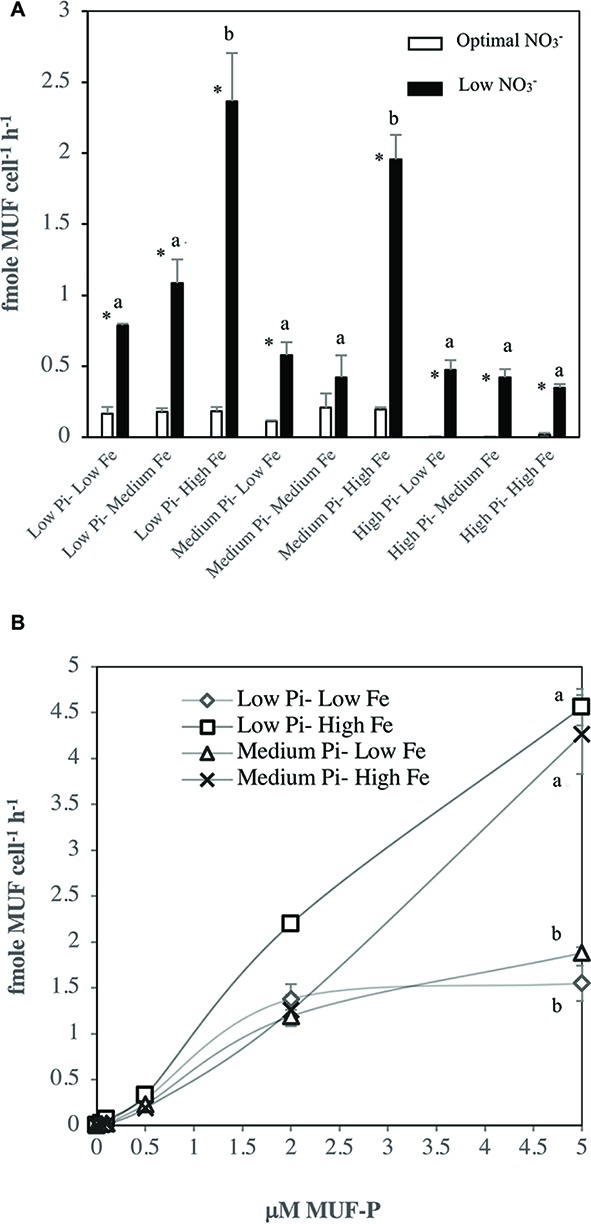
Rates of alkaline phosphatase activity (APA) in Halothece sp. PCC 7418 under optimal and [Low ] conditions. (A) End point assay of APA under optimal and [Low ] conditions with 2 μM of MUF-P. (B) Saturation curve, velocity (V, fmole MUF cell−1 h−1) vs. substrate (S, μM) under [Low ] in [Low –Low Fe], [Low –High Fe], [Medium –Medium Fe], and [Medium –High Fe], up to 5 μM of MUF-P. is represented as Pi. In (A,B), values are the mean and the error bar is the spanning range between the duplicate measurements. Asterisks (*) indicate significant differences (p < 0.05) between optimal and [Low ] conditions of the same and Fe combination treatments, by individual t student test. Different letters indicate pairwise significant differences (p < 0.05) among treatments in [Low ] using a post-hoc test (Bonferroni) after ANOVA over the whole dataset was done.
