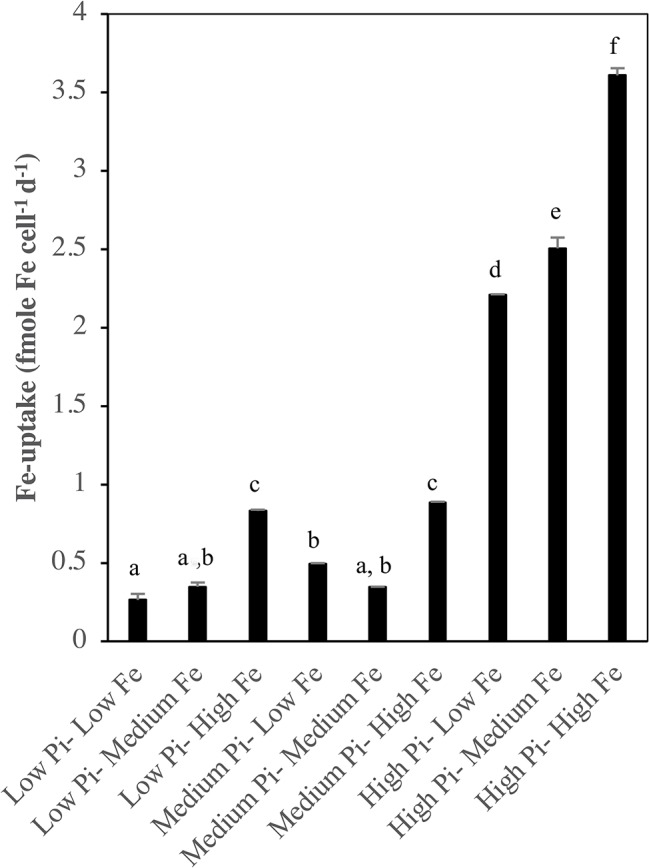
Figure 8.

Fe-uptake in Halothece sp. PCC 7418 (fmole Fe cell−1 day−1) measured as the difference of the initial Fe concentration and the final Fe concentration at day 10 day of the experiment under [Low ]. is represented as Pi. Values are the mean, and the error bar is the spanning range between the duplicate measurements, and letters indicate significant differences (p < 0.05) between treatments using a post-hoc test (Bonferroni) after ANOVA over the whole dataset was done.
