Figure 9.

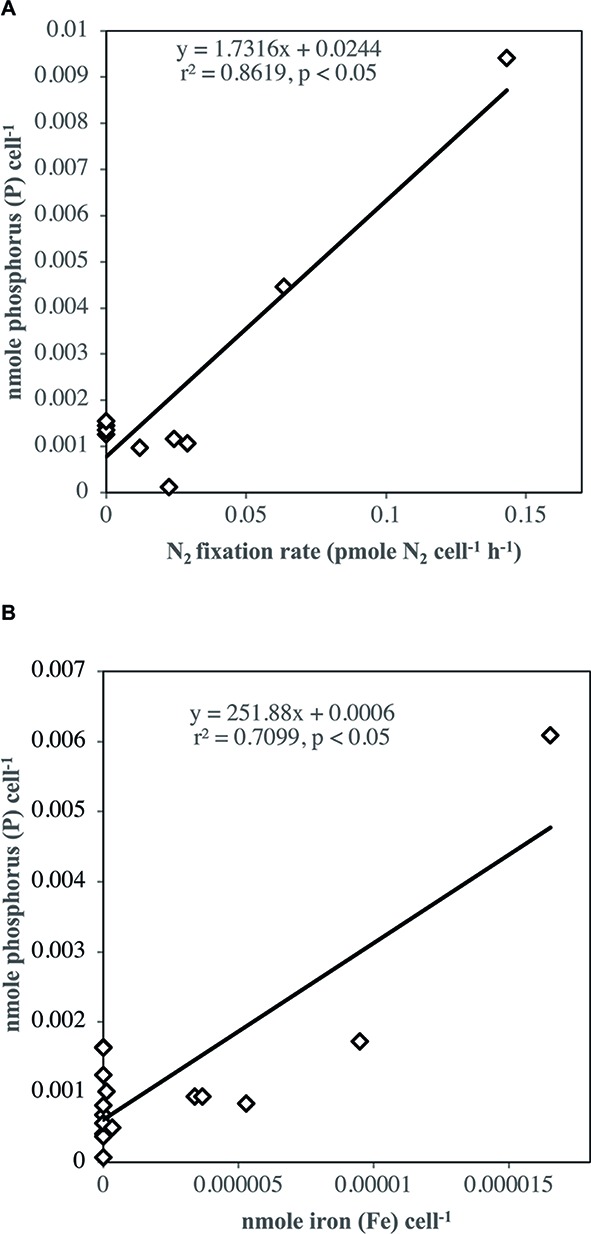
Linear regression analyses (A) between P-cellular content and N2 fixation and (B) between P and Fe-cellular content. Cellular content was measured in [Low ] using pooled data from all and Fe combination treatments.

Linear regression analyses (A) between P-cellular content and N2 fixation and (B) between P and Fe-cellular content. Cellular content was measured in [Low ] using pooled data from all and Fe combination treatments.