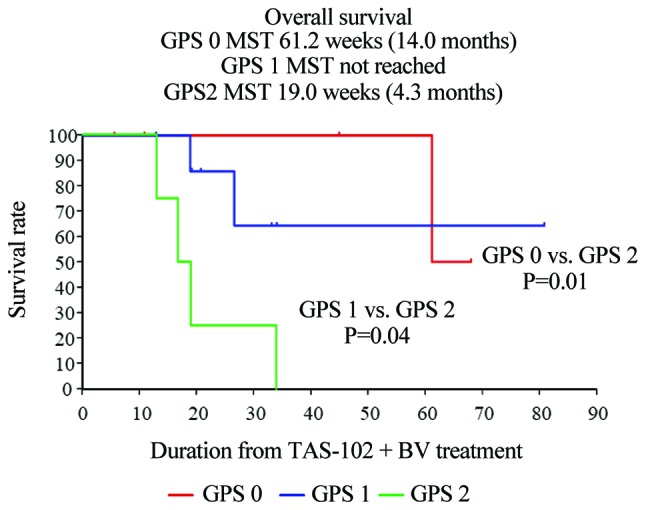
Figure 6.

Kaplan-Meier curves demonstrated that the median OS was significantly different among mGPS groups (mGPS 0 vs. mGPS 2, P=0.01; mGPS 1 vs. mGPS 2, P=0.04). The median OS in the mGPS 0, 1 and 2 groups was 14.0, not reached, and 2 months, respectively. OS, overall survival; mGPS, modified Glasgow Prognostic Score.
