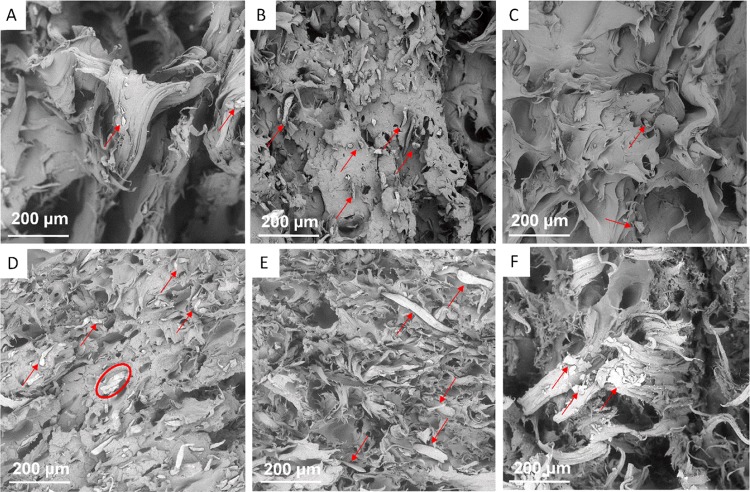
Figure 9.
SEM images of PP/cellulose fracture surfaces. (A) cPP 10 wt % paper, (B) cPP 10 wt % cardboard, (C) cPP 10 wt % wood, (D) rPP 10 wt % paper, (E) rPP 10 wt % cardboard, (F) rPP 10 wt % wood. The scale bar denotes 200 μm. Arrows show locations of filler particles. The circle shows agglomeration of filler particles.

