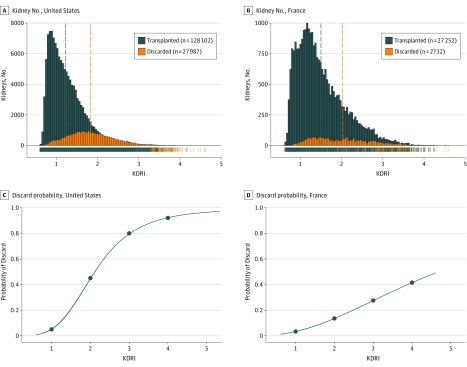
Figure 1. Deceased Donor Kidneys Transplanted and Discarded in the United States and France Between 2004 and 2014 and Their Kidney Donor Risk Index (KDRI) Scoresa .
Data are based on 156 089 recovered kidneys in the United States, including 128 102 transplanted and 27 987 discarded kidneys, and on 29 984 recovered kidneys in France, including 27 252 transplanted and 2732 discarded kidneys. A, The distribution of KDRI scores for transplanted (blue) and discarded (orange) kidneys in the United States. B, The distribution of the KDRI score for transplanted (blue) and discarded (orange) kidneys in France. Dashed vertical lines correspond to the mean KDRI of transplanted kidneys (dashed blue) and discarded (dashed orange) kidneys. C, The probability of discard in the United States by KDRI; and D, The probability of discard in France by KDRI. The blue curve corresponds to the probability of discard according to the KDRI in the United States (C) and in France (D).
aLower KDRI indicates better kidney quality.

