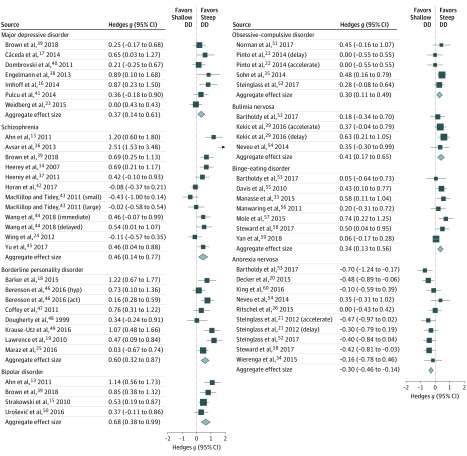
Figure 2. Forest Plots of Primary Meta-analytic Results by Disorder Category.
Act indicates actual rewards; DD, delay discounting; and Hyp, hypothetical rewards. Square data points reflect effect size (Hedges g) for each study, with whiskers reflecting 95% CIs. Diamonds reflect aggregate effect sizes (Hedges g) for each category, with width of diamond indicating 95% CI.

