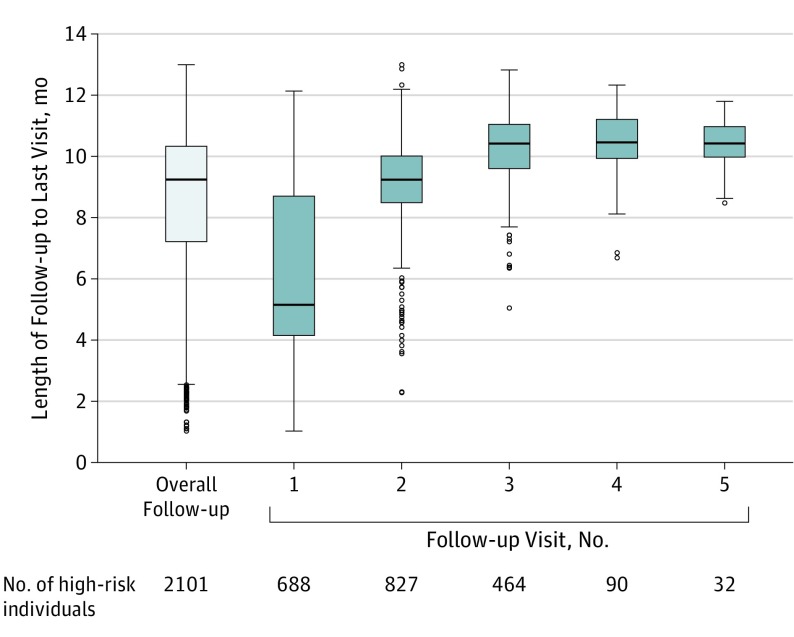
Figure 2. Distribution of Follow-up Visits by Kaders.
Kaders are nonphysician community health care workers in Indonesia. The horizontal line inside the box represents the median. The lower margin of the box represents the first quartile, and the upper margin of the box represents the third quartile. The upper horizontal line outside the box denotes the maximum value or the third quartile plus 1.5 times the interquartile range, whichever is smaller. The lower horizontal line outside the box denotes the minimum value or the first quartile minus 1.5 times the interquartile range, whichever is larger. The circles represent extreme observations.

