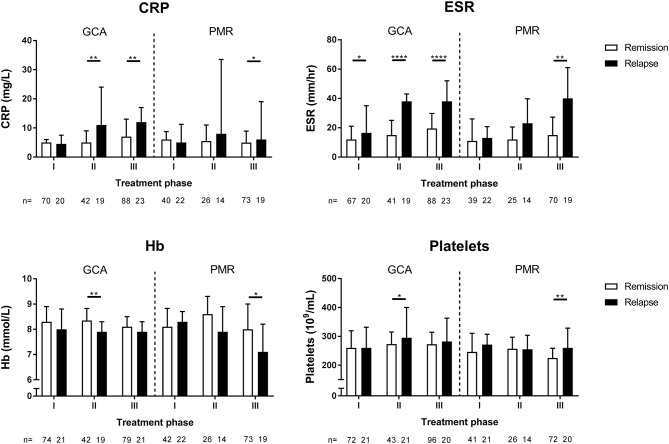
Figure 5.
Levels of inflammatory markers during treatment phase I, II, and III for GCA and PMR patients in remission and during relapse. The definition of remission and relapse was based solely on clinical signs and symptoms. Data is expressed as median plus interquartile range. The number of measurements is indicated by n. Statistical significance is expressed as follows: *p < 0.05, **p < 0.01, ****p < 0.0001 (Mann Whitney U-test).

