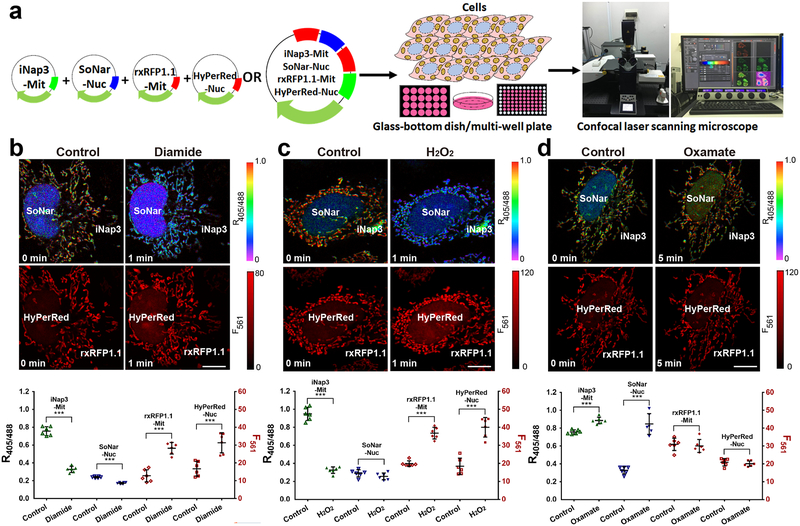
Figure 4. Four-parametric imaging of NADPH, NADH, thiol redox, and H2O2 in single cells.
(a) General overview of the procedure for four-parametric imaging in single cells. (b-d) Four-parametric imaging (top) and fluorescence changes (bottom, n=6 cells) in HeLa cells simultaneously expressing mitochondrial-localized iNap3, nuclear-localized SoNar, mitochondrial-localized rxRFP1.1, and nuclear-localized HyPerRed in response to 200 μM diamide (b), 200 μM H2O2 (c), or 2 mM oxamate (d). Data are the mean ± s.d. All p values were obtained using unpaired two-tailed Student’s t test. ***p < 0.001. Scale bars, 10 μm.

